Paiute vs Immigrants from Moldova Median Female Earnings
COMPARE
Paiute
Immigrants from Moldova
Median Female Earnings
Median Female Earnings Comparison
Paiute
Immigrants from Moldova
$36,056
MEDIAN FEMALE EARNINGS
0.1/ 100
METRIC RATING
285th/ 347
METRIC RANK
$42,304
MEDIAN FEMALE EARNINGS
99.6/ 100
METRIC RATING
80th/ 347
METRIC RANK
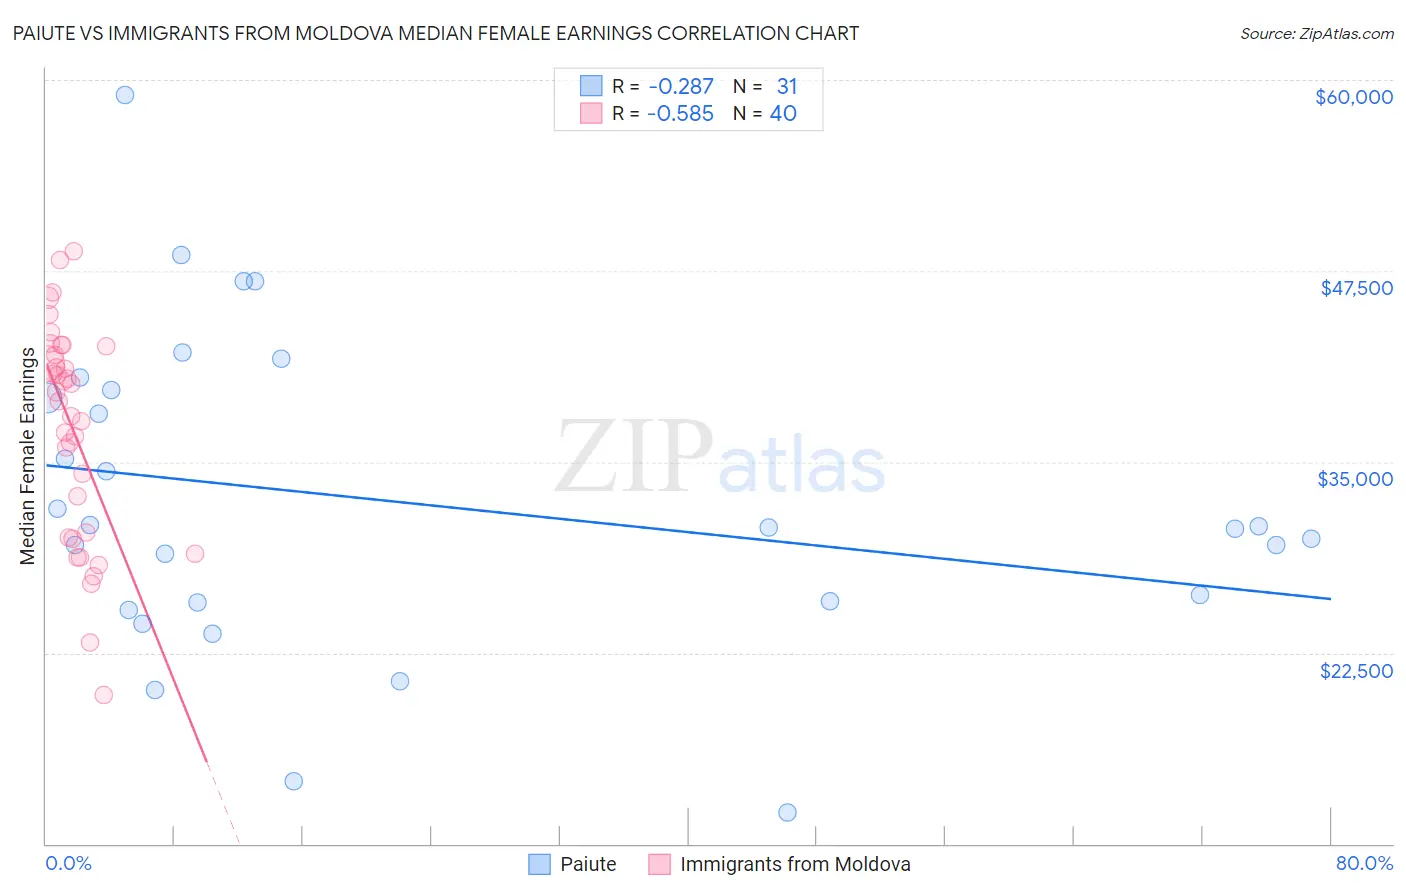
Paiute vs Immigrants from Moldova Median Female Earnings Correlation Chart
The statistical analysis conducted on geographies consisting of 58,379,978 people shows a weak negative correlation between the proportion of Paiute and median female earnings in the United States with a correlation coefficient (R) of -0.287 and weighted average of $36,056. Similarly, the statistical analysis conducted on geographies consisting of 124,390,401 people shows a substantial negative correlation between the proportion of Immigrants from Moldova and median female earnings in the United States with a correlation coefficient (R) of -0.585 and weighted average of $42,304, a difference of 17.3%.
Median Female Earnings Correlation Summary
| Measurement | Paiute | Immigrants from Moldova |
| Minimum | $12,045 | $19,712 |
| Maximum | $59,011 | $48,785 |
| Range | $46,966 | $29,073 |
| Mean | $32,370 | $37,125 |
| Median | $30,682 | $39,287 |
| Interquartile 25% (IQ1) | $25,816 | $30,213 |
| Interquartile 75% (IQ3) | $39,733 | $42,291 |
| Interquartile Range (IQR) | $13,917 | $12,078 |
| Standard Deviation (Sample) | $10,286 | $7,033 |
| Standard Deviation (Population) | $10,119 | $6,945 |
Similar Demographics by Median Female Earnings
Demographics Similar to Paiute by Median Female Earnings
In terms of median female earnings, the demographic groups most similar to Paiute are Osage ($36,034, a difference of 0.060%), Immigrants from Nicaragua ($36,023, a difference of 0.090%), Immigrants from Zaire ($36,017, a difference of 0.11%), Indonesian ($36,140, a difference of 0.23%), and Bangladeshi ($35,960, a difference of 0.27%).
| Demographics | Rating | Rank | Median Female Earnings |
| U.S. Virgin Islanders | 0.1 /100 | #278 | Tragic $36,424 |
| Immigrants | Caribbean | 0.1 /100 | #279 | Tragic $36,414 |
| Iroquois | 0.1 /100 | #280 | Tragic $36,408 |
| Spanish Americans | 0.1 /100 | #281 | Tragic $36,391 |
| Haitians | 0.1 /100 | #282 | Tragic $36,374 |
| Immigrants | Haiti | 0.1 /100 | #283 | Tragic $36,203 |
| Indonesians | 0.1 /100 | #284 | Tragic $36,140 |
| Paiute | 0.1 /100 | #285 | Tragic $36,056 |
| Osage | 0.0 /100 | #286 | Tragic $36,034 |
| Immigrants | Nicaragua | 0.0 /100 | #287 | Tragic $36,023 |
| Immigrants | Zaire | 0.0 /100 | #288 | Tragic $36,017 |
| Bangladeshis | 0.0 /100 | #289 | Tragic $35,960 |
| Central American Indians | 0.0 /100 | #290 | Tragic $35,930 |
| Blackfeet | 0.0 /100 | #291 | Tragic $35,864 |
| Americans | 0.0 /100 | #292 | Tragic $35,777 |
Demographics Similar to Immigrants from Moldova by Median Female Earnings
In terms of median female earnings, the demographic groups most similar to Immigrants from Moldova are Immigrants from Southern Europe ($42,275, a difference of 0.070%), Greek ($42,336, a difference of 0.080%), Immigrants from Morocco ($42,229, a difference of 0.18%), Immigrants from Kazakhstan ($42,386, a difference of 0.19%), and Immigrants from Albania ($42,388, a difference of 0.20%).
| Demographics | Rating | Rank | Median Female Earnings |
| Mongolians | 99.7 /100 | #73 | Exceptional $42,542 |
| Immigrants | South Africa | 99.7 /100 | #74 | Exceptional $42,508 |
| New Zealanders | 99.7 /100 | #75 | Exceptional $42,446 |
| Immigrants | Italy | 99.7 /100 | #76 | Exceptional $42,446 |
| Immigrants | Albania | 99.6 /100 | #77 | Exceptional $42,388 |
| Immigrants | Kazakhstan | 99.6 /100 | #78 | Exceptional $42,386 |
| Greeks | 99.6 /100 | #79 | Exceptional $42,336 |
| Immigrants | Moldova | 99.6 /100 | #80 | Exceptional $42,304 |
| Immigrants | Southern Europe | 99.5 /100 | #81 | Exceptional $42,275 |
| Immigrants | Morocco | 99.5 /100 | #82 | Exceptional $42,229 |
| Immigrants | Sierra Leone | 99.5 /100 | #83 | Exceptional $42,214 |
| Armenians | 99.5 /100 | #84 | Exceptional $42,212 |
| Laotians | 99.4 /100 | #85 | Exceptional $42,133 |
| Immigrants | St. Vincent and the Grenadines | 99.3 /100 | #86 | Exceptional $42,108 |
| Lithuanians | 99.3 /100 | #87 | Exceptional $42,108 |