Malaysian vs Immigrants from Moldova In Labor Force | Age 16-19
COMPARE
Malaysian
Immigrants from Moldova
In Labor Force | Age 16-19
In Labor Force | Age 16-19 Comparison
Malaysians
Immigrants from Moldova
39.7%
IN LABOR FORCE | AGE 16-19
99.9/ 100
METRIC RATING
76th/ 347
METRIC RANK
37.7%
IN LABOR FORCE | AGE 16-19
91.9/ 100
METRIC RATING
139th/ 347
METRIC RANK
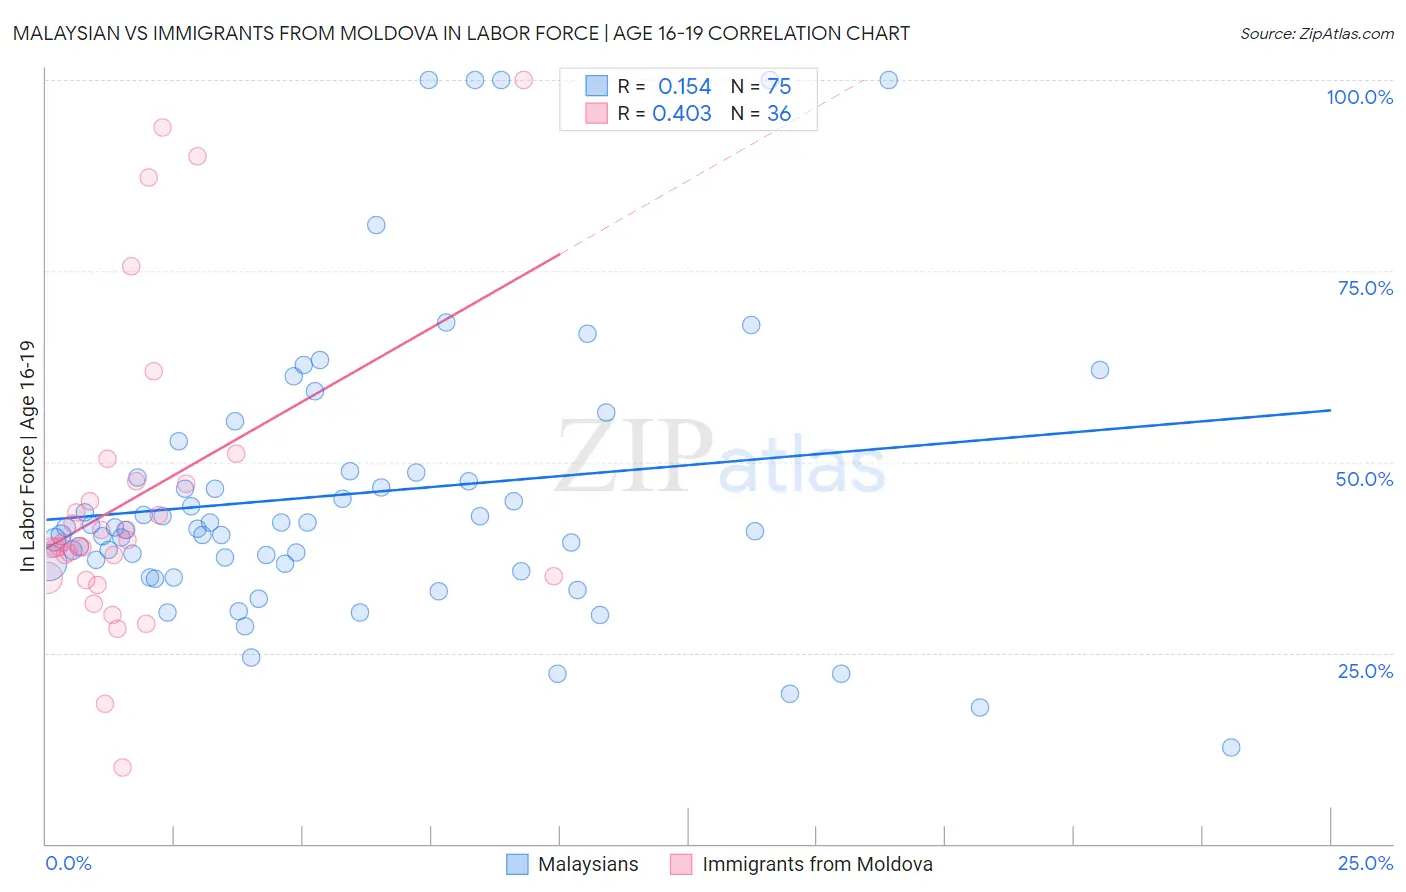
Malaysian vs Immigrants from Moldova In Labor Force | Age 16-19 Correlation Chart
The statistical analysis conducted on geographies consisting of 225,967,692 people shows a poor positive correlation between the proportion of Malaysians and labor force participation rate among population between the ages 16 and 19 in the United States with a correlation coefficient (R) of 0.154 and weighted average of 39.7%. Similarly, the statistical analysis conducted on geographies consisting of 124,314,308 people shows a moderate positive correlation between the proportion of Immigrants from Moldova and labor force participation rate among population between the ages 16 and 19 in the United States with a correlation coefficient (R) of 0.403 and weighted average of 37.7%, a difference of 5.4%.
In Labor Force | Age 16-19 Correlation Summary
| Measurement | Malaysian | Immigrants from Moldova |
| Minimum | 12.6% | 10.0% |
| Maximum | 100.0% | 100.0% |
| Range | 87.4% | 90.0% |
| Mean | 45.8% | 45.3% |
| Median | 41.3% | 39.2% |
| Interquartile 25% (IQ1) | 36.7% | 34.9% |
| Interquartile 75% (IQ3) | 48.6% | 47.3% |
| Interquartile Range (IQR) | 11.9% | 12.4% |
| Standard Deviation (Sample) | 18.9% | 20.2% |
| Standard Deviation (Population) | 18.8% | 19.9% |
Similar Demographics by In Labor Force | Age 16-19
Demographics Similar to Malaysians by In Labor Force | Age 16-19
In terms of in labor force | age 16-19, the demographic groups most similar to Malaysians are Immigrants from Portugal (39.7%, a difference of 0.13%), French American Indian (39.8%, a difference of 0.27%), Hungarian (39.8%, a difference of 0.29%), Immigrants from Middle Africa (39.9%, a difference of 0.52%), and Austrian (39.5%, a difference of 0.52%).
| Demographics | Rating | Rank | In Labor Force | Age 16-19 |
| Potawatomi | 99.9 /100 | #69 | Exceptional 40.0% |
| Portuguese | 99.9 /100 | #70 | Exceptional 40.0% |
| Serbians | 99.9 /100 | #71 | Exceptional 39.9% |
| Iroquois | 99.9 /100 | #72 | Exceptional 39.9% |
| Immigrants | Middle Africa | 99.9 /100 | #73 | Exceptional 39.9% |
| Hungarians | 99.9 /100 | #74 | Exceptional 39.8% |
| French American Indians | 99.9 /100 | #75 | Exceptional 39.8% |
| Malaysians | 99.9 /100 | #76 | Exceptional 39.7% |
| Immigrants | Portugal | 99.9 /100 | #77 | Exceptional 39.7% |
| Austrians | 99.8 /100 | #78 | Exceptional 39.5% |
| Marshallese | 99.8 /100 | #79 | Exceptional 39.5% |
| Immigrants | Iraq | 99.8 /100 | #80 | Exceptional 39.4% |
| Shoshone | 99.7 /100 | #81 | Exceptional 39.3% |
| Basques | 99.7 /100 | #82 | Exceptional 39.3% |
| Spanish | 99.7 /100 | #83 | Exceptional 39.3% |
Demographics Similar to Immigrants from Moldova by In Labor Force | Age 16-19
In terms of in labor force | age 16-19, the demographic groups most similar to Immigrants from Moldova are Comanche (37.7%, a difference of 0.010%), Estonian (37.7%, a difference of 0.030%), Syrian (37.6%, a difference of 0.17%), Australian (37.8%, a difference of 0.24%), and Cajun (37.8%, a difference of 0.24%).
| Demographics | Rating | Rank | In Labor Force | Age 16-19 |
| Immigrants | Oceania | 94.7 /100 | #132 | Exceptional 37.9% |
| Cheyenne | 94.6 /100 | #133 | Exceptional 37.9% |
| Immigrants | Netherlands | 93.7 /100 | #134 | Exceptional 37.8% |
| Macedonians | 93.4 /100 | #135 | Exceptional 37.8% |
| Australians | 93.2 /100 | #136 | Exceptional 37.8% |
| Cajuns | 93.2 /100 | #137 | Exceptional 37.8% |
| Comanche | 91.9 /100 | #138 | Exceptional 37.7% |
| Immigrants | Moldova | 91.9 /100 | #139 | Exceptional 37.7% |
| Estonians | 91.7 /100 | #140 | Exceptional 37.7% |
| Syrians | 90.7 /100 | #141 | Exceptional 37.6% |
| Sierra Leoneans | 89.7 /100 | #142 | Excellent 37.6% |
| Pakistanis | 89.5 /100 | #143 | Excellent 37.6% |
| Japanese | 89.3 /100 | #144 | Excellent 37.5% |
| Paiute | 89.3 /100 | #145 | Excellent 37.5% |
| Immigrants | Western Europe | 88.9 /100 | #146 | Excellent 37.5% |