Scottish vs Immigrants from Guatemala Median Female Earnings
COMPARE
Scottish
Immigrants from Guatemala
Median Female Earnings
Median Female Earnings Comparison
Scottish
Immigrants from Guatemala
$38,397
MEDIAN FEMALE EARNINGS
6.3/ 100
METRIC RATING
227th/ 347
METRIC RANK
$35,444
MEDIAN FEMALE EARNINGS
0.0/ 100
METRIC RATING
299th/ 347
METRIC RANK
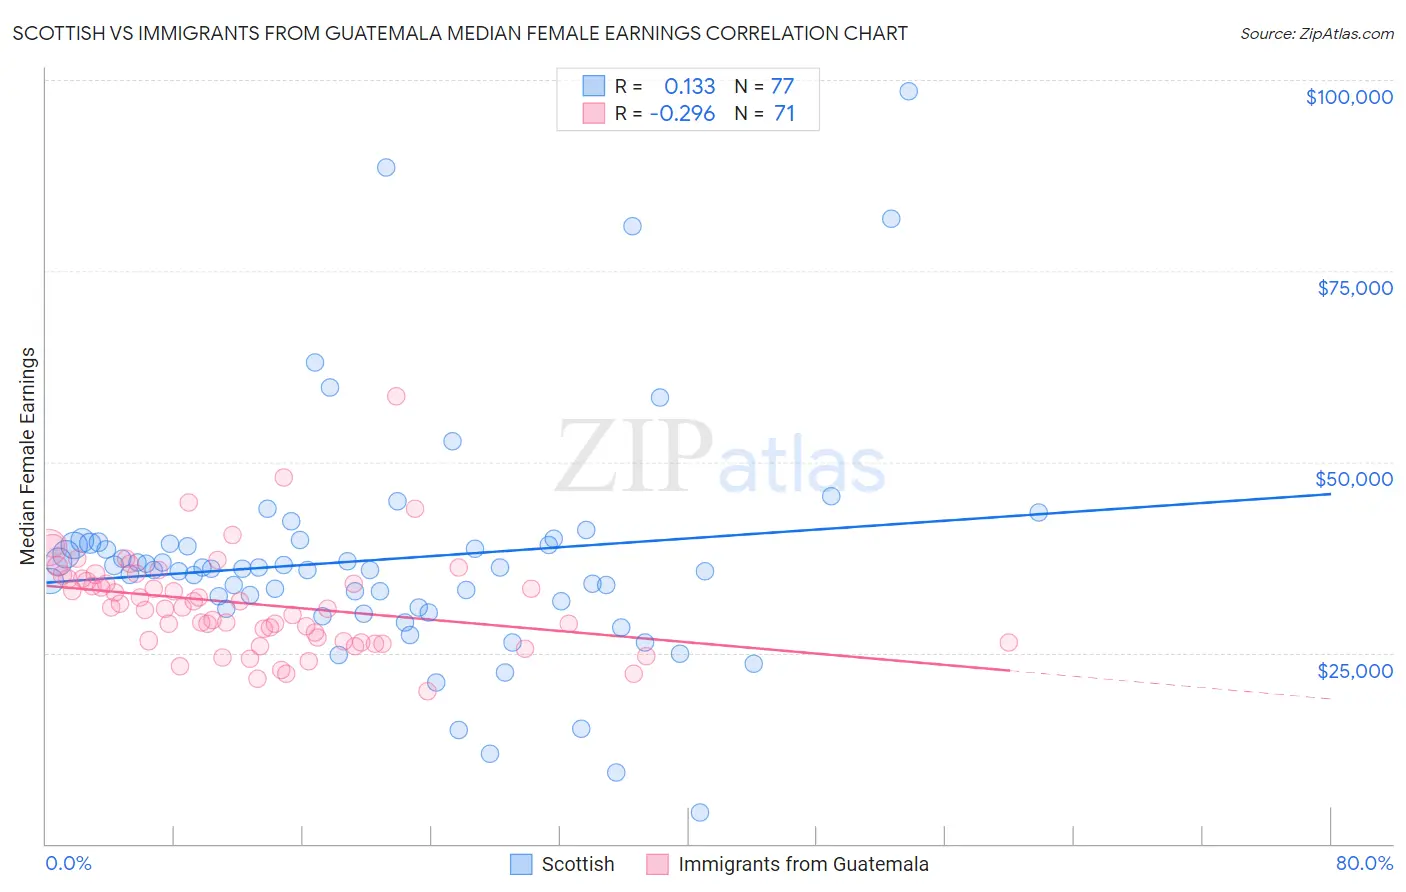
Scottish vs Immigrants from Guatemala Median Female Earnings Correlation Chart
The statistical analysis conducted on geographies consisting of 565,316,168 people shows a poor positive correlation between the proportion of Scottish and median female earnings in the United States with a correlation coefficient (R) of 0.133 and weighted average of $38,397. Similarly, the statistical analysis conducted on geographies consisting of 377,157,500 people shows a weak negative correlation between the proportion of Immigrants from Guatemala and median female earnings in the United States with a correlation coefficient (R) of -0.296 and weighted average of $35,444, a difference of 8.3%.
Median Female Earnings Correlation Summary
| Measurement | Scottish | Immigrants from Guatemala |
| Minimum | $4,115 | $20,000 |
| Maximum | $98,472 | $58,669 |
| Range | $94,357 | $38,669 |
| Mean | $37,218 | $31,424 |
| Median | $35,990 | $30,854 |
| Interquartile 25% (IQ1) | $30,914 | $26,583 |
| Interquartile 75% (IQ3) | $39,333 | $34,723 |
| Interquartile Range (IQR) | $8,419 | $8,140 |
| Standard Deviation (Sample) | $15,319 | $6,504 |
| Standard Deviation (Population) | $15,219 | $6,458 |
Similar Demographics by Median Female Earnings
Demographics Similar to Scottish by Median Female Earnings
In terms of median female earnings, the demographic groups most similar to Scottish are Subsaharan African ($38,391, a difference of 0.020%), Belgian ($38,382, a difference of 0.040%), French Canadian ($38,436, a difference of 0.10%), Basque ($38,352, a difference of 0.12%), and French ($38,457, a difference of 0.15%).
| Demographics | Rating | Rank | Median Female Earnings |
| Yugoslavians | 8.8 /100 | #220 | Tragic $38,573 |
| Immigrants | Azores | 8.8 /100 | #221 | Tragic $38,573 |
| Japanese | 8.1 /100 | #222 | Tragic $38,528 |
| Immigrants | Sudan | 7.8 /100 | #223 | Tragic $38,511 |
| Native Hawaiians | 7.1 /100 | #224 | Tragic $38,461 |
| French | 7.0 /100 | #225 | Tragic $38,457 |
| French Canadians | 6.8 /100 | #226 | Tragic $38,436 |
| Scottish | 6.3 /100 | #227 | Tragic $38,397 |
| Sub-Saharan Africans | 6.2 /100 | #228 | Tragic $38,391 |
| Belgians | 6.1 /100 | #229 | Tragic $38,382 |
| Basques | 5.7 /100 | #230 | Tragic $38,352 |
| Somalis | 5.5 /100 | #231 | Tragic $38,333 |
| Scandinavians | 5.2 /100 | #232 | Tragic $38,306 |
| Tongans | 5.1 /100 | #233 | Tragic $38,288 |
| Celtics | 5.0 /100 | #234 | Tragic $38,283 |
Demographics Similar to Immigrants from Guatemala by Median Female Earnings
In terms of median female earnings, the demographic groups most similar to Immigrants from Guatemala are Immigrants from Micronesia ($35,477, a difference of 0.090%), Hmong ($35,498, a difference of 0.15%), Yuman ($35,377, a difference of 0.19%), Pima ($35,326, a difference of 0.33%), and Black/African American ($35,315, a difference of 0.36%).
| Demographics | Rating | Rank | Median Female Earnings |
| Americans | 0.0 /100 | #292 | Tragic $35,777 |
| Guatemalans | 0.0 /100 | #293 | Tragic $35,695 |
| Cheyenne | 0.0 /100 | #294 | Tragic $35,673 |
| Comanche | 0.0 /100 | #295 | Tragic $35,661 |
| Mexican American Indians | 0.0 /100 | #296 | Tragic $35,629 |
| Hmong | 0.0 /100 | #297 | Tragic $35,498 |
| Immigrants | Micronesia | 0.0 /100 | #298 | Tragic $35,477 |
| Immigrants | Guatemala | 0.0 /100 | #299 | Tragic $35,444 |
| Yuman | 0.0 /100 | #300 | Tragic $35,377 |
| Pima | 0.0 /100 | #301 | Tragic $35,326 |
| Blacks/African Americans | 0.0 /100 | #302 | Tragic $35,315 |
| Immigrants | Latin America | 0.0 /100 | #303 | Tragic $35,307 |
| Crow | 0.0 /100 | #304 | Tragic $35,266 |
| Bahamians | 0.0 /100 | #305 | Tragic $35,125 |
| Fijians | 0.0 /100 | #306 | Tragic $35,114 |