Comanche vs Yuman Per Capita Income
COMPARE
Comanche
Yuman
Per Capita Income
Per Capita Income Comparison
Comanche
Yuman
$38,088
PER CAPITA INCOME
0.2/ 100
METRIC RATING
277th/ 347
METRIC RANK
$33,236
PER CAPITA INCOME
0.0/ 100
METRIC RATING
335th/ 347
METRIC RANK
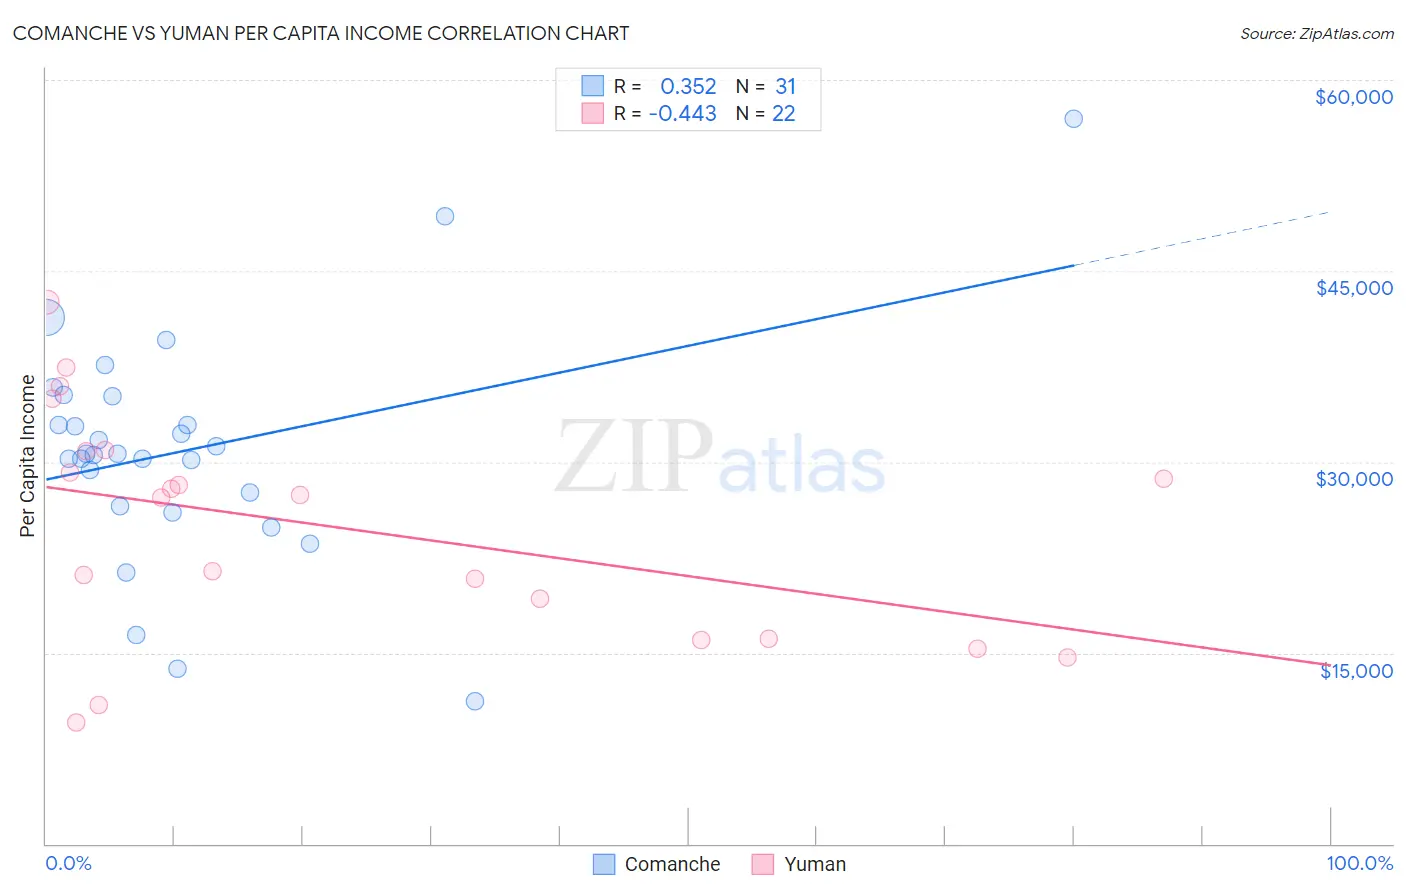
Comanche vs Yuman Per Capita Income Correlation Chart
The statistical analysis conducted on geographies consisting of 109,786,530 people shows a mild positive correlation between the proportion of Comanche and per capita income in the United States with a correlation coefficient (R) of 0.352 and weighted average of $38,088. Similarly, the statistical analysis conducted on geographies consisting of 40,696,310 people shows a moderate negative correlation between the proportion of Yuman and per capita income in the United States with a correlation coefficient (R) of -0.443 and weighted average of $33,236, a difference of 14.6%.
Per Capita Income Correlation Summary
| Measurement | Comanche | Yuman |
| Minimum | $11,178 | $9,533 |
| Maximum | $56,980 | $42,569 |
| Range | $45,802 | $33,036 |
| Mean | $30,910 | $24,831 |
| Median | $30,680 | $27,284 |
| Interquartile 25% (IQ1) | $26,547 | $16,137 |
| Interquartile 75% (IQ3) | $35,132 | $30,879 |
| Interquartile Range (IQR) | $8,585 | $14,742 |
| Standard Deviation (Sample) | $9,053 | $8,979 |
| Standard Deviation (Population) | $8,906 | $8,772 |
Similar Demographics by Per Capita Income
Demographics Similar to Comanche by Per Capita Income
In terms of per capita income, the demographic groups most similar to Comanche are Immigrants from Nicaragua ($38,065, a difference of 0.060%), Hmong ($38,120, a difference of 0.080%), Colville ($38,047, a difference of 0.11%), Potawatomi ($38,046, a difference of 0.11%), and Immigrants from Liberia ($38,165, a difference of 0.20%).
| Demographics | Rating | Rank | Per Capita Income |
| Immigrants | Belize | 0.3 /100 | #270 | Tragic $38,614 |
| Central Americans | 0.3 /100 | #271 | Tragic $38,560 |
| Immigrants | Cabo Verde | 0.3 /100 | #272 | Tragic $38,540 |
| Nepalese | 0.3 /100 | #273 | Tragic $38,442 |
| Immigrants | El Salvador | 0.3 /100 | #274 | Tragic $38,394 |
| Immigrants | Liberia | 0.2 /100 | #275 | Tragic $38,165 |
| Hmong | 0.2 /100 | #276 | Tragic $38,120 |
| Comanche | 0.2 /100 | #277 | Tragic $38,088 |
| Immigrants | Nicaragua | 0.2 /100 | #278 | Tragic $38,065 |
| Colville | 0.2 /100 | #279 | Tragic $38,047 |
| Potawatomi | 0.2 /100 | #280 | Tragic $38,046 |
| Immigrants | Dominica | 0.2 /100 | #281 | Tragic $37,952 |
| Immigrants | Laos | 0.1 /100 | #282 | Tragic $37,857 |
| Pennsylvania Germans | 0.1 /100 | #283 | Tragic $37,842 |
| Africans | 0.1 /100 | #284 | Tragic $37,785 |
Demographics Similar to Yuman by Per Capita Income
In terms of per capita income, the demographic groups most similar to Yuman are Native/Alaskan ($33,279, a difference of 0.13%), Yakama ($33,009, a difference of 0.69%), Houma ($32,996, a difference of 0.73%), Immigrants from Yemen ($33,696, a difference of 1.4%), and Sioux ($33,921, a difference of 2.1%).
| Demographics | Rating | Rank | Per Capita Income |
| Menominee | 0.0 /100 | #328 | Tragic $34,578 |
| Mexicans | 0.0 /100 | #329 | Tragic $34,559 |
| Spanish American Indians | 0.0 /100 | #330 | Tragic $34,195 |
| Immigrants | Mexico | 0.0 /100 | #331 | Tragic $33,931 |
| Sioux | 0.0 /100 | #332 | Tragic $33,921 |
| Immigrants | Yemen | 0.0 /100 | #333 | Tragic $33,696 |
| Natives/Alaskans | 0.0 /100 | #334 | Tragic $33,279 |
| Yuman | 0.0 /100 | #335 | Tragic $33,236 |
| Yakama | 0.0 /100 | #336 | Tragic $33,009 |
| Houma | 0.0 /100 | #337 | Tragic $32,996 |
| Arapaho | 0.0 /100 | #338 | Tragic $32,345 |
| Pueblo | 0.0 /100 | #339 | Tragic $32,012 |
| Crow | 0.0 /100 | #340 | Tragic $31,729 |
| Puerto Ricans | 0.0 /100 | #341 | Tragic $31,268 |
| Hopi | 0.0 /100 | #342 | Tragic $31,177 |