Iroquois vs Immigrants from Fiji Per Capita Income
COMPARE
Iroquois
Immigrants from Fiji
Per Capita Income
Per Capita Income Comparison
Iroquois
Immigrants from Fiji
$39,104
PER CAPITA INCOME
0.6/ 100
METRIC RATING
262nd/ 347
METRIC RANK
$42,694
PER CAPITA INCOME
25.2/ 100
METRIC RATING
194th/ 347
METRIC RANK
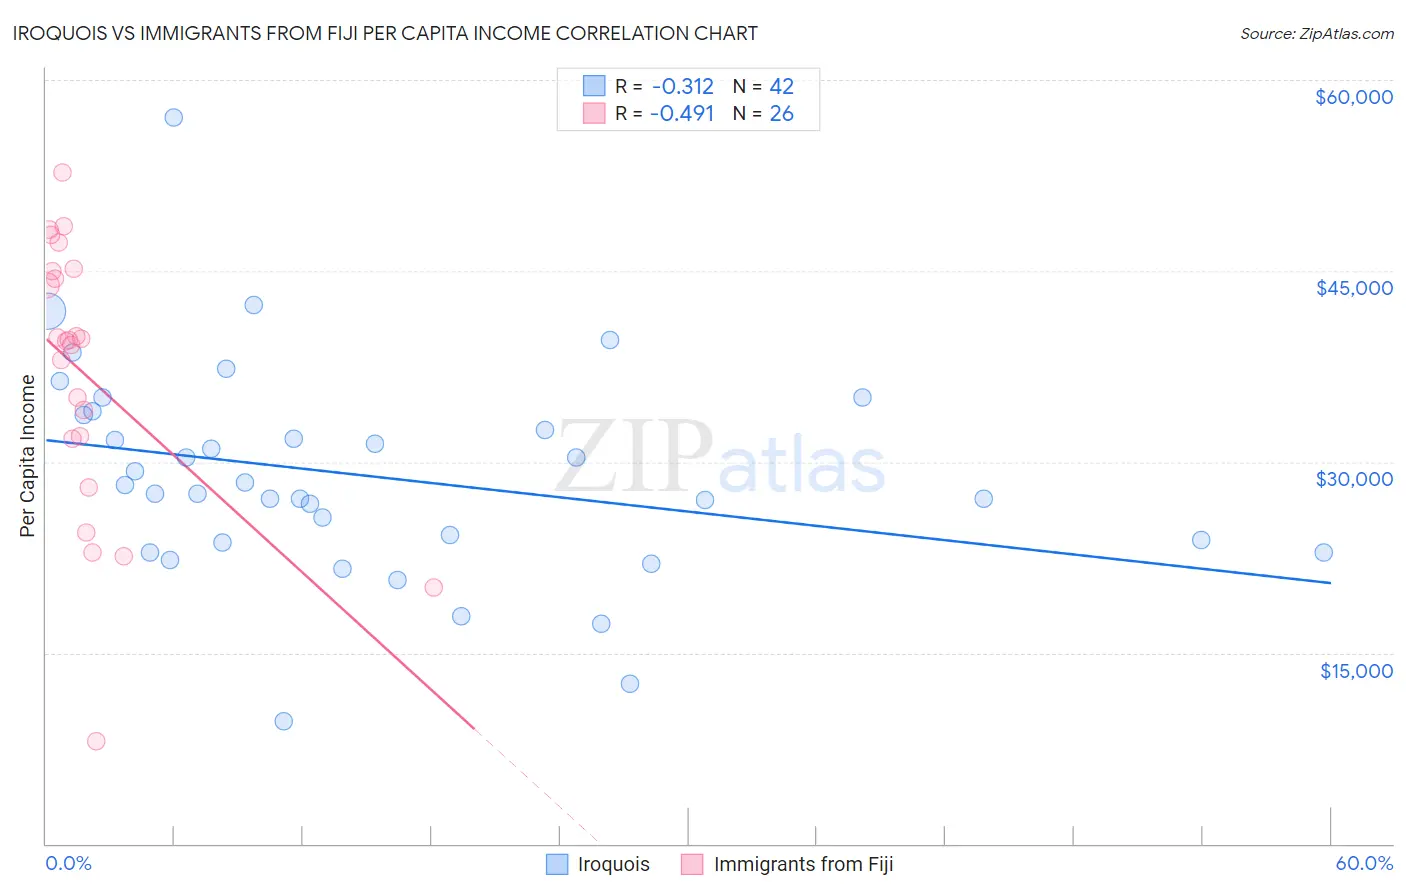
Iroquois vs Immigrants from Fiji Per Capita Income Correlation Chart
The statistical analysis conducted on geographies consisting of 207,308,382 people shows a mild negative correlation between the proportion of Iroquois and per capita income in the United States with a correlation coefficient (R) of -0.312 and weighted average of $39,104. Similarly, the statistical analysis conducted on geographies consisting of 93,756,204 people shows a moderate negative correlation between the proportion of Immigrants from Fiji and per capita income in the United States with a correlation coefficient (R) of -0.491 and weighted average of $42,694, a difference of 9.2%.
Per Capita Income Correlation Summary
| Measurement | Iroquois | Immigrants from Fiji |
| Minimum | $9,644 | $8,026 |
| Maximum | $57,083 | $52,700 |
| Range | $47,439 | $44,674 |
| Mean | $28,880 | $36,824 |
| Median | $27,852 | $39,532 |
| Interquartile 25% (IQ1) | $23,617 | $31,785 |
| Interquartile 75% (IQ3) | $33,731 | $44,942 |
| Interquartile Range (IQR) | $10,114 | $13,157 |
| Standard Deviation (Sample) | $8,453 | $10,646 |
| Standard Deviation (Population) | $8,352 | $10,440 |
Similar Demographics by Per Capita Income
Demographics Similar to Iroquois by Per Capita Income
In terms of per capita income, the demographic groups most similar to Iroquois are Marshallese ($39,108, a difference of 0.010%), Belizean ($39,097, a difference of 0.020%), Alaskan Athabascan ($39,163, a difference of 0.15%), American ($39,039, a difference of 0.16%), and Malaysian ($39,194, a difference of 0.23%).
| Demographics | Rating | Rank | Per Capita Income |
| Immigrants | Middle Africa | 1.0 /100 | #255 | Tragic $39,529 |
| Hawaiians | 0.8 /100 | #256 | Tragic $39,403 |
| Nicaraguans | 0.8 /100 | #257 | Tragic $39,372 |
| Jamaicans | 0.7 /100 | #258 | Tragic $39,231 |
| Malaysians | 0.7 /100 | #259 | Tragic $39,194 |
| Alaskan Athabascans | 0.6 /100 | #260 | Tragic $39,163 |
| Marshallese | 0.6 /100 | #261 | Tragic $39,108 |
| Iroquois | 0.6 /100 | #262 | Tragic $39,104 |
| Belizeans | 0.6 /100 | #263 | Tragic $39,097 |
| Americans | 0.6 /100 | #264 | Tragic $39,039 |
| Spanish Americans | 0.5 /100 | #265 | Tragic $39,012 |
| Salvadorans | 0.5 /100 | #266 | Tragic $38,858 |
| Immigrants | Zaire | 0.4 /100 | #267 | Tragic $38,848 |
| Liberians | 0.4 /100 | #268 | Tragic $38,780 |
| Immigrants | Jamaica | 0.4 /100 | #269 | Tragic $38,766 |
Demographics Similar to Immigrants from Fiji by Per Capita Income
In terms of per capita income, the demographic groups most similar to Immigrants from Fiji are Immigrants from Kenya ($42,661, a difference of 0.080%), Immigrants from Sierra Leone ($42,752, a difference of 0.13%), Iraqi ($42,760, a difference of 0.16%), Dutch ($42,605, a difference of 0.21%), and Yugoslavian ($42,792, a difference of 0.23%).
| Demographics | Rating | Rank | Per Capita Income |
| Immigrants | Colombia | 31.5 /100 | #187 | Fair $42,971 |
| Immigrants | Africa | 31.0 /100 | #188 | Fair $42,950 |
| Bermudans | 30.1 /100 | #189 | Fair $42,911 |
| Kenyans | 27.7 /100 | #190 | Fair $42,808 |
| Yugoslavians | 27.4 /100 | #191 | Fair $42,792 |
| Iraqis | 26.7 /100 | #192 | Fair $42,760 |
| Immigrants | Sierra Leone | 26.5 /100 | #193 | Fair $42,752 |
| Immigrants | Fiji | 25.2 /100 | #194 | Fair $42,694 |
| Immigrants | Kenya | 24.5 /100 | #195 | Fair $42,661 |
| Dutch | 23.4 /100 | #196 | Fair $42,605 |
| Scotch-Irish | 22.6 /100 | #197 | Fair $42,563 |
| Immigrants | Portugal | 19.7 /100 | #198 | Poor $42,412 |
| Barbadians | 19.6 /100 | #199 | Poor $42,406 |
| Vietnamese | 19.0 /100 | #200 | Poor $42,368 |
| Immigrants | Thailand | 17.6 /100 | #201 | Poor $42,289 |