Cherokee vs Immigrants from Czechoslovakia Median Family Income
COMPARE
Cherokee
Immigrants from Czechoslovakia
Median Family Income
Median Family Income Comparison
Cherokee
Immigrants from Czechoslovakia
$88,209
MEDIAN FAMILY INCOME
0.1/ 100
METRIC RATING
288th/ 347
METRIC RANK
$116,165
MEDIAN FAMILY INCOME
99.9/ 100
METRIC RATING
50th/ 347
METRIC RANK
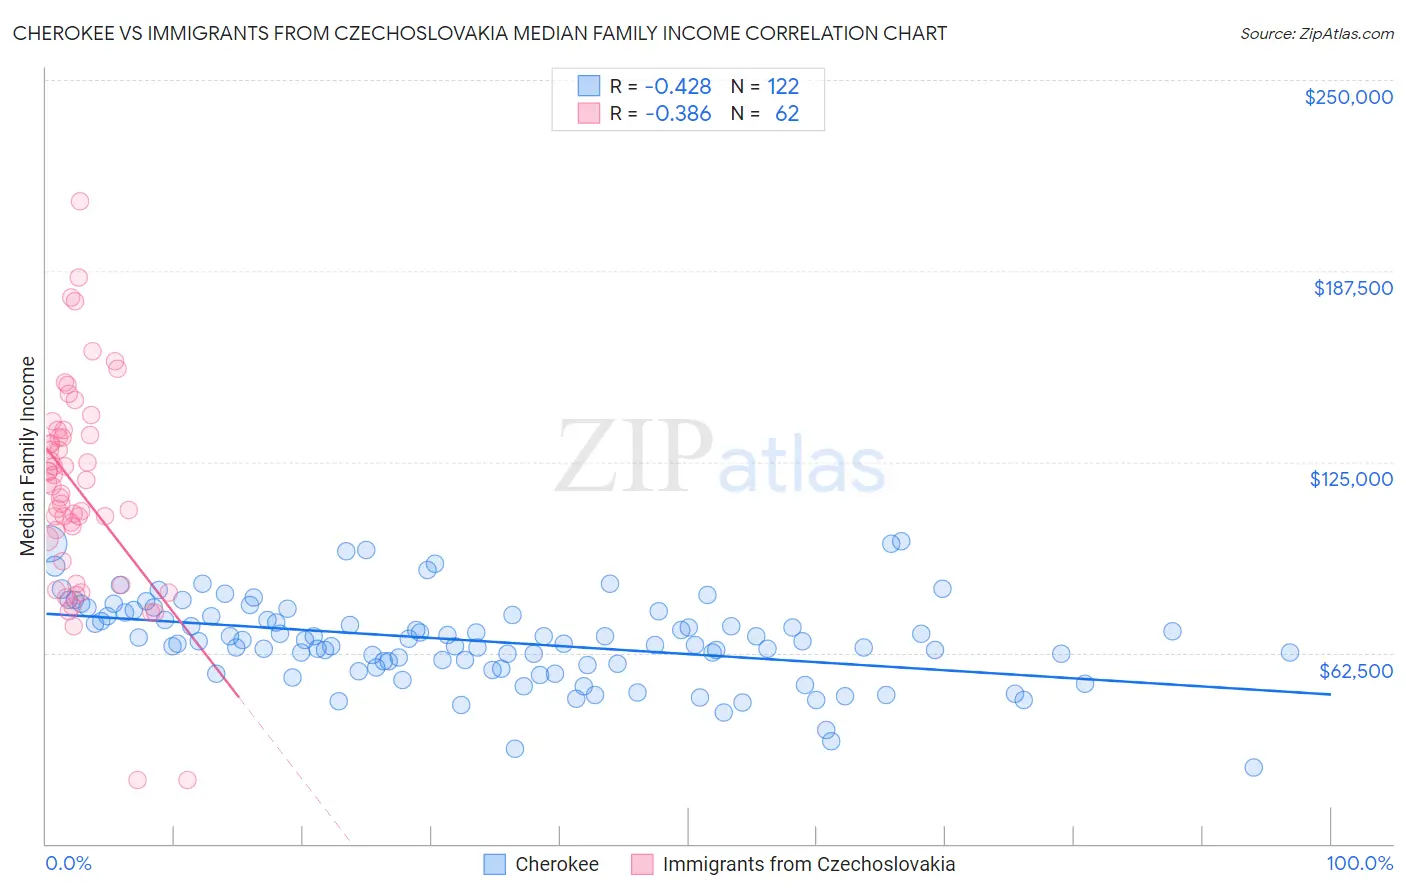
Cherokee vs Immigrants from Czechoslovakia Median Family Income Correlation Chart
The statistical analysis conducted on geographies consisting of 493,078,219 people shows a moderate negative correlation between the proportion of Cherokee and median family income in the United States with a correlation coefficient (R) of -0.428 and weighted average of $88,209. Similarly, the statistical analysis conducted on geographies consisting of 195,434,997 people shows a mild negative correlation between the proportion of Immigrants from Czechoslovakia and median family income in the United States with a correlation coefficient (R) of -0.386 and weighted average of $116,165, a difference of 31.7%.
Median Family Income Correlation Summary
| Measurement | Cherokee | Immigrants from Czechoslovakia |
| Minimum | $25,000 | $20,761 |
| Maximum | $98,929 | $210,139 |
| Range | $73,929 | $189,378 |
| Mean | $66,366 | $116,278 |
| Median | $66,333 | $117,481 |
| Interquartile 25% (IQ1) | $58,393 | $99,688 |
| Interquartile 75% (IQ3) | $74,712 | $133,750 |
| Interquartile Range (IQR) | $16,319 | $34,062 |
| Standard Deviation (Sample) | $13,972 | $34,098 |
| Standard Deviation (Population) | $13,915 | $33,822 |
Similar Demographics by Median Family Income
Demographics Similar to Cherokee by Median Family Income
In terms of median family income, the demographic groups most similar to Cherokee are Potawatomi ($88,265, a difference of 0.060%), Immigrants from Nicaragua ($88,267, a difference of 0.070%), Indonesian ($88,301, a difference of 0.10%), Guatemalan ($88,295, a difference of 0.10%), and Bangladeshi ($88,358, a difference of 0.17%).
| Demographics | Rating | Rank | Median Family Income |
| Blackfeet | 0.1 /100 | #281 | Tragic $88,717 |
| Comanche | 0.1 /100 | #282 | Tragic $88,556 |
| Bangladeshis | 0.1 /100 | #283 | Tragic $88,358 |
| Indonesians | 0.1 /100 | #284 | Tragic $88,301 |
| Guatemalans | 0.1 /100 | #285 | Tragic $88,295 |
| Immigrants | Nicaragua | 0.1 /100 | #286 | Tragic $88,267 |
| Potawatomi | 0.1 /100 | #287 | Tragic $88,265 |
| Cherokee | 0.1 /100 | #288 | Tragic $88,209 |
| Central American Indians | 0.1 /100 | #289 | Tragic $88,034 |
| Shoshone | 0.1 /100 | #290 | Tragic $87,872 |
| Immigrants | Cabo Verde | 0.1 /100 | #291 | Tragic $87,830 |
| Africans | 0.1 /100 | #292 | Tragic $87,820 |
| Ute | 0.0 /100 | #293 | Tragic $87,596 |
| Fijians | 0.0 /100 | #294 | Tragic $87,387 |
| Yaqui | 0.0 /100 | #295 | Tragic $87,289 |
Demographics Similar to Immigrants from Czechoslovakia by Median Family Income
In terms of median family income, the demographic groups most similar to Immigrants from Czechoslovakia are Chinese ($116,188, a difference of 0.020%), Immigrants from South Africa ($116,286, a difference of 0.10%), Immigrants from Malaysia ($115,880, a difference of 0.25%), Maltese ($115,862, a difference of 0.26%), and Immigrants from Norway ($115,847, a difference of 0.27%).
| Demographics | Rating | Rank | Median Family Income |
| Bulgarians | 100.0 /100 | #43 | Exceptional $117,818 |
| Cambodians | 100.0 /100 | #44 | Exceptional $117,780 |
| Immigrants | Greece | 99.9 /100 | #45 | Exceptional $117,344 |
| Immigrants | Russia | 99.9 /100 | #46 | Exceptional $116,942 |
| Immigrants | Austria | 99.9 /100 | #47 | Exceptional $116,830 |
| Immigrants | South Africa | 99.9 /100 | #48 | Exceptional $116,286 |
| Chinese | 99.9 /100 | #49 | Exceptional $116,188 |
| Immigrants | Czechoslovakia | 99.9 /100 | #50 | Exceptional $116,165 |
| Immigrants | Malaysia | 99.9 /100 | #51 | Exceptional $115,880 |
| Maltese | 99.9 /100 | #52 | Exceptional $115,862 |
| Immigrants | Norway | 99.9 /100 | #53 | Exceptional $115,847 |
| Immigrants | Europe | 99.9 /100 | #54 | Exceptional $115,523 |
| Lithuanians | 99.8 /100 | #55 | Exceptional $115,395 |
| New Zealanders | 99.8 /100 | #56 | Exceptional $115,230 |
| Greeks | 99.8 /100 | #57 | Exceptional $115,192 |