Soviet Union vs Immigrants from Czechoslovakia Median Family Income
COMPARE
Soviet Union
Immigrants from Czechoslovakia
Median Family Income
Median Family Income Comparison
Soviet Union
Immigrants from Czechoslovakia
$119,262
MEDIAN FAMILY INCOME
100.0/ 100
METRIC RATING
35th/ 347
METRIC RANK
$116,165
MEDIAN FAMILY INCOME
99.9/ 100
METRIC RATING
50th/ 347
METRIC RANK
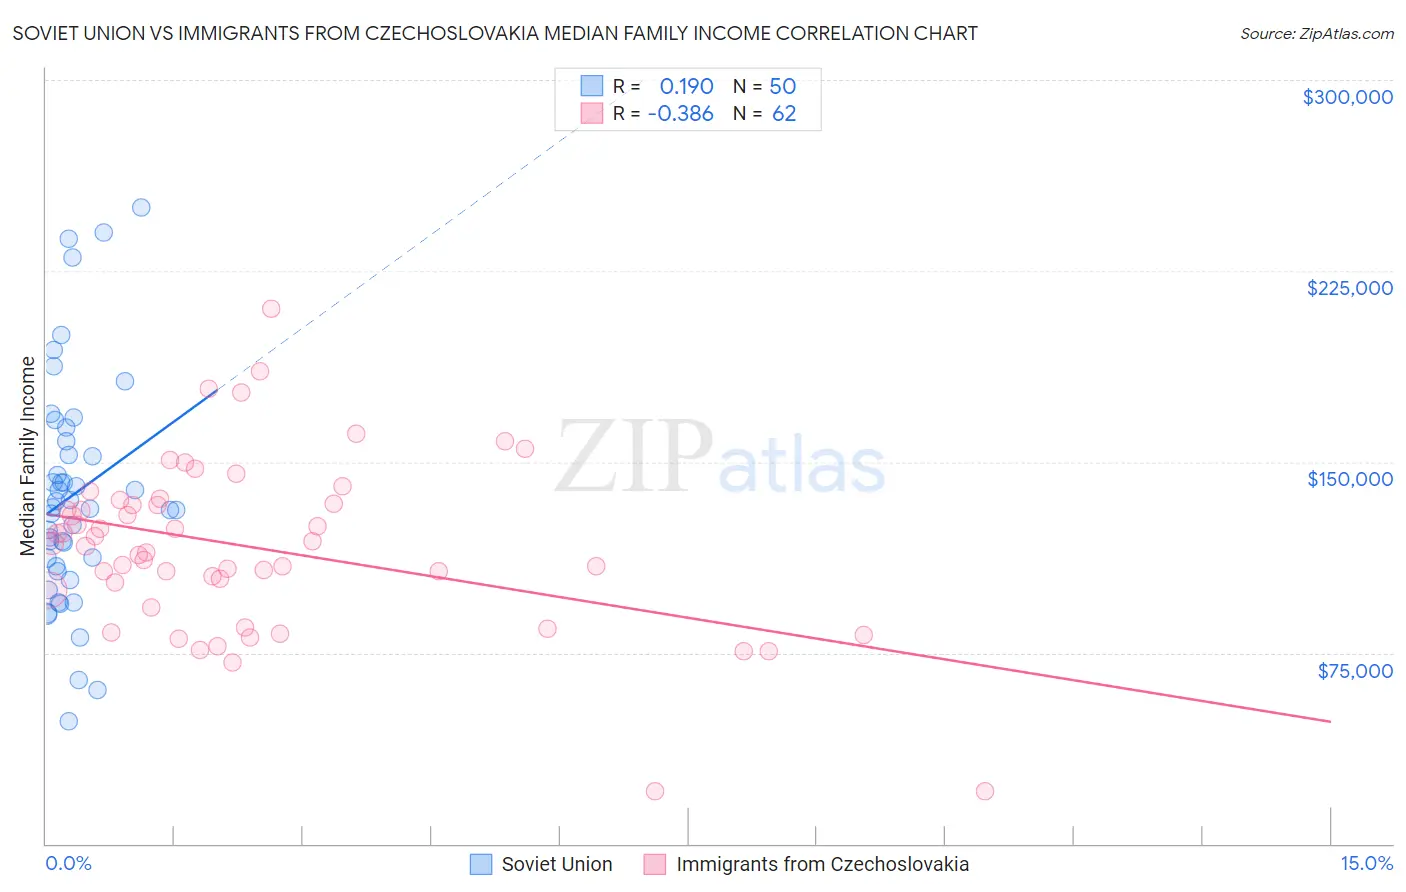
Soviet Union vs Immigrants from Czechoslovakia Median Family Income Correlation Chart
The statistical analysis conducted on geographies consisting of 43,509,630 people shows a poor positive correlation between the proportion of Soviet Union and median family income in the United States with a correlation coefficient (R) of 0.190 and weighted average of $119,262. Similarly, the statistical analysis conducted on geographies consisting of 195,434,997 people shows a mild negative correlation between the proportion of Immigrants from Czechoslovakia and median family income in the United States with a correlation coefficient (R) of -0.386 and weighted average of $116,165, a difference of 2.7%.
Median Family Income Correlation Summary
| Measurement | Soviet Union | Immigrants from Czechoslovakia |
| Minimum | $48,254 | $20,761 |
| Maximum | $250,001 | $210,139 |
| Range | $201,747 | $189,378 |
| Mean | $137,051 | $116,278 |
| Median | $132,006 | $117,481 |
| Interquartile 25% (IQ1) | $109,232 | $99,688 |
| Interquartile 75% (IQ3) | $157,989 | $133,750 |
| Interquartile Range (IQR) | $48,757 | $34,062 |
| Standard Deviation (Sample) | $44,628 | $34,098 |
| Standard Deviation (Population) | $44,180 | $33,822 |
Demographics Similar to Soviet Union and Immigrants from Czechoslovakia by Median Family Income
In terms of median family income, the demographic groups most similar to Soviet Union are Bolivian ($119,479, a difference of 0.18%), Bhutanese ($119,800, a difference of 0.45%), Asian ($119,955, a difference of 0.58%), Israeli ($118,577, a difference of 0.58%), and Australian ($118,440, a difference of 0.69%). Similarly, the demographic groups most similar to Immigrants from Czechoslovakia are Chinese ($116,188, a difference of 0.020%), Immigrants from South Africa ($116,286, a difference of 0.10%), Immigrants from Malaysia ($115,880, a difference of 0.25%), Maltese ($115,862, a difference of 0.26%), and Immigrants from Austria ($116,830, a difference of 0.57%).
| Demographics | Rating | Rank | Median Family Income |
| Asians | 100.0 /100 | #32 | Exceptional $119,955 |
| Bhutanese | 100.0 /100 | #33 | Exceptional $119,800 |
| Bolivians | 100.0 /100 | #34 | Exceptional $119,479 |
| Soviet Union | 100.0 /100 | #35 | Exceptional $119,262 |
| Israelis | 100.0 /100 | #36 | Exceptional $118,577 |
| Australians | 100.0 /100 | #37 | Exceptional $118,440 |
| Immigrants | Turkey | 100.0 /100 | #38 | Exceptional $118,325 |
| Immigrants | Asia | 100.0 /100 | #39 | Exceptional $118,291 |
| Immigrants | Lithuania | 100.0 /100 | #40 | Exceptional $118,053 |
| Estonians | 100.0 /100 | #41 | Exceptional $118,013 |
| Immigrants | Bolivia | 100.0 /100 | #42 | Exceptional $117,912 |
| Bulgarians | 100.0 /100 | #43 | Exceptional $117,818 |
| Cambodians | 100.0 /100 | #44 | Exceptional $117,780 |
| Immigrants | Greece | 99.9 /100 | #45 | Exceptional $117,344 |
| Immigrants | Russia | 99.9 /100 | #46 | Exceptional $116,942 |
| Immigrants | Austria | 99.9 /100 | #47 | Exceptional $116,830 |
| Immigrants | South Africa | 99.9 /100 | #48 | Exceptional $116,286 |
| Chinese | 99.9 /100 | #49 | Exceptional $116,188 |
| Immigrants | Czechoslovakia | 99.9 /100 | #50 | Exceptional $116,165 |
| Immigrants | Malaysia | 99.9 /100 | #51 | Exceptional $115,880 |
| Maltese | 99.9 /100 | #52 | Exceptional $115,862 |