Macedonian vs Immigrants from Greece Median Earnings
COMPARE
Macedonian
Immigrants from Greece
Median Earnings
Median Earnings Comparison
Macedonians
Immigrants from Greece
$49,893
MEDIAN EARNINGS
99.2/ 100
METRIC RATING
91st/ 347
METRIC RANK
$53,282
MEDIAN EARNINGS
100.0/ 100
METRIC RATING
33rd/ 347
METRIC RANK
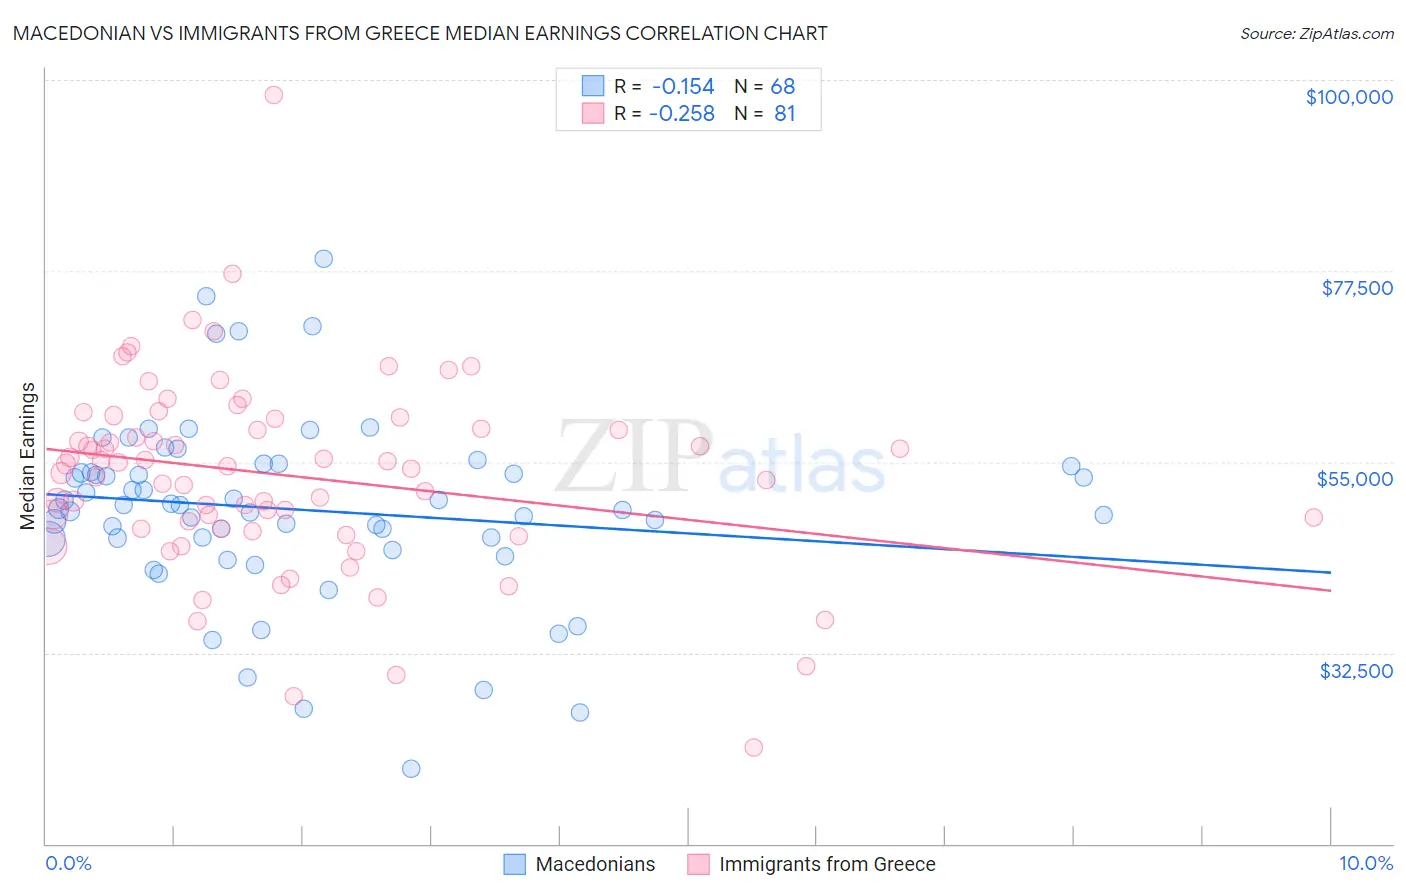
Macedonian vs Immigrants from Greece Median Earnings Correlation Chart
The statistical analysis conducted on geographies consisting of 132,586,624 people shows a poor negative correlation between the proportion of Macedonians and median earnings in the United States with a correlation coefficient (R) of -0.154 and weighted average of $49,893. Similarly, the statistical analysis conducted on geographies consisting of 216,859,908 people shows a weak negative correlation between the proportion of Immigrants from Greece and median earnings in the United States with a correlation coefficient (R) of -0.258 and weighted average of $53,282, a difference of 6.8%.
Median Earnings Correlation Summary
| Measurement | Macedonian | Immigrants from Greece |
| Minimum | $18,816 | $21,296 |
| Maximum | $78,907 | $98,167 |
| Range | $60,091 | $76,871 |
| Mean | $49,392 | $53,424 |
| Median | $49,655 | $54,495 |
| Interquartile 25% (IQ1) | $45,965 | $47,153 |
| Interquartile 75% (IQ3) | $54,145 | $59,515 |
| Interquartile Range (IQR) | $8,180 | $12,362 |
| Standard Deviation (Sample) | $10,833 | $11,394 |
| Standard Deviation (Population) | $10,753 | $11,323 |
Similar Demographics by Median Earnings
Demographics Similar to Macedonians by Median Earnings
In terms of median earnings, the demographic groups most similar to Macedonians are Italian ($49,915, a difference of 0.040%), Immigrants from Argentina ($49,841, a difference of 0.11%), Armenian ($49,804, a difference of 0.18%), Croatian ($49,724, a difference of 0.34%), and Immigrants from England ($49,722, a difference of 0.34%).
| Demographics | Rating | Rank | Median Earnings |
| Immigrants | Hungary | 99.5 /100 | #84 | Exceptional $50,227 |
| Immigrants | Kazakhstan | 99.5 /100 | #85 | Exceptional $50,225 |
| Immigrants | Canada | 99.5 /100 | #86 | Exceptional $50,192 |
| Immigrants | Uzbekistan | 99.5 /100 | #87 | Exceptional $50,151 |
| Albanians | 99.4 /100 | #88 | Exceptional $50,116 |
| Immigrants | North America | 99.4 /100 | #89 | Exceptional $50,108 |
| Italians | 99.3 /100 | #90 | Exceptional $49,915 |
| Macedonians | 99.2 /100 | #91 | Exceptional $49,893 |
| Immigrants | Argentina | 99.2 /100 | #92 | Exceptional $49,841 |
| Armenians | 99.1 /100 | #93 | Exceptional $49,804 |
| Croatians | 99.0 /100 | #94 | Exceptional $49,724 |
| Immigrants | England | 99.0 /100 | #95 | Exceptional $49,722 |
| Immigrants | Lebanon | 99.0 /100 | #96 | Exceptional $49,682 |
| Immigrants | North Macedonia | 98.9 /100 | #97 | Exceptional $49,658 |
| Immigrants | Northern Africa | 98.9 /100 | #98 | Exceptional $49,648 |
Demographics Similar to Immigrants from Greece by Median Earnings
In terms of median earnings, the demographic groups most similar to Immigrants from Greece are Immigrants from Sri Lanka ($53,268, a difference of 0.030%), Immigrants from Asia ($53,310, a difference of 0.050%), Russian ($53,334, a difference of 0.10%), Immigrants from Switzerland ($53,211, a difference of 0.13%), and Immigrants from Denmark ($53,186, a difference of 0.18%).
| Demographics | Rating | Rank | Median Earnings |
| Immigrants | Northern Europe | 100.0 /100 | #26 | Exceptional $53,872 |
| Asians | 100.0 /100 | #27 | Exceptional $53,690 |
| Immigrants | France | 100.0 /100 | #28 | Exceptional $53,490 |
| Immigrants | Russia | 100.0 /100 | #29 | Exceptional $53,457 |
| Cambodians | 100.0 /100 | #30 | Exceptional $53,386 |
| Russians | 100.0 /100 | #31 | Exceptional $53,334 |
| Immigrants | Asia | 100.0 /100 | #32 | Exceptional $53,310 |
| Immigrants | Greece | 100.0 /100 | #33 | Exceptional $53,282 |
| Immigrants | Sri Lanka | 100.0 /100 | #34 | Exceptional $53,268 |
| Immigrants | Switzerland | 100.0 /100 | #35 | Exceptional $53,211 |
| Immigrants | Denmark | 100.0 /100 | #36 | Exceptional $53,186 |
| Immigrants | Belarus | 100.0 /100 | #37 | Exceptional $53,043 |
| Latvians | 100.0 /100 | #38 | Exceptional $53,001 |
| Immigrants | Turkey | 100.0 /100 | #39 | Exceptional $52,960 |
| Israelis | 100.0 /100 | #40 | Exceptional $52,937 |