Lumbee vs Bahamian Single Mother Households
COMPARE
Lumbee
Bahamian
Single Mother Households
Single Mother Households Comparison
Lumbee
Bahamians
9.1%
SINGLE MOTHER HOUSEHOLDS
0.0/ 100
METRIC RATING
340th/ 347
METRIC RANK
8.3%
SINGLE MOTHER HOUSEHOLDS
0.0/ 100
METRIC RATING
320th/ 347
METRIC RANK
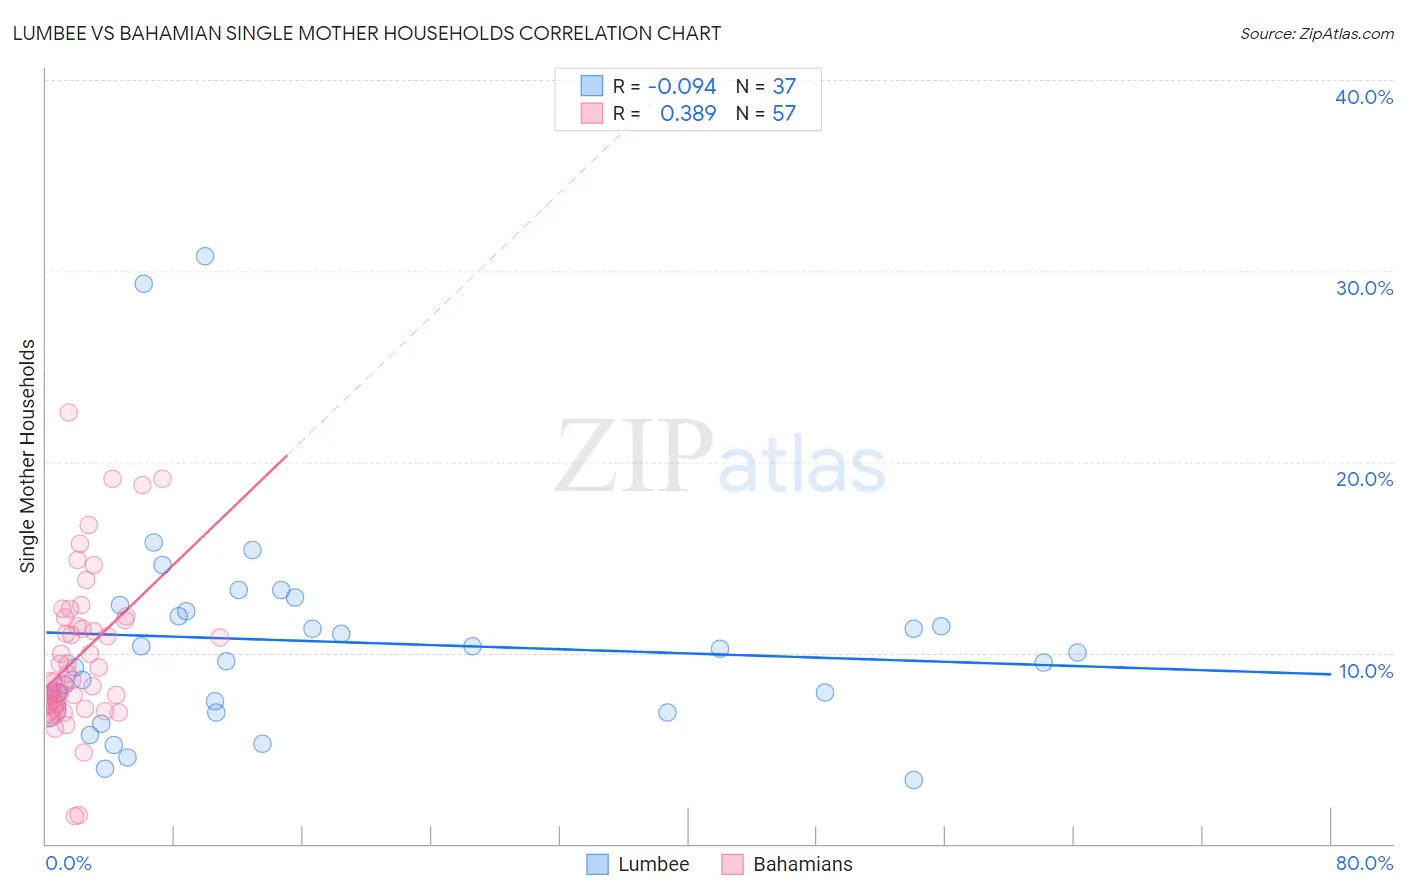
Lumbee vs Bahamian Single Mother Households Correlation Chart
The statistical analysis conducted on geographies consisting of 92,236,041 people shows a slight negative correlation between the proportion of Lumbee and percentage of single mother households in the United States with a correlation coefficient (R) of -0.094 and weighted average of 9.1%. Similarly, the statistical analysis conducted on geographies consisting of 112,454,075 people shows a mild positive correlation between the proportion of Bahamians and percentage of single mother households in the United States with a correlation coefficient (R) of 0.389 and weighted average of 8.3%, a difference of 10.3%.
Single Mother Households Correlation Summary
| Measurement | Lumbee | Bahamian |
| Minimum | 3.3% | 1.4% |
| Maximum | 30.7% | 22.6% |
| Range | 27.4% | 21.1% |
| Mean | 10.6% | 9.9% |
| Median | 10.0% | 8.5% |
| Interquartile 25% (IQ1) | 7.0% | 7.3% |
| Interquartile 75% (IQ3) | 12.3% | 11.8% |
| Interquartile Range (IQR) | 5.3% | 4.5% |
| Standard Deviation (Sample) | 5.7% | 4.1% |
| Standard Deviation (Population) | 5.6% | 4.0% |
Demographics Similar to Lumbee and Bahamians by Single Mother Households
In terms of single mother households, the demographic groups most similar to Lumbee are Black/African American (9.0%, a difference of 1.2%), Cape Verdean (8.9%, a difference of 2.8%), Navajo (8.8%, a difference of 2.9%), Puerto Rican (8.7%, a difference of 4.1%), and Immigrants from Dominica (8.7%, a difference of 4.2%). Similarly, the demographic groups most similar to Bahamians are Immigrants from Senegal (8.3%, a difference of 0.24%), Pima (8.3%, a difference of 0.32%), Haitian (8.3%, a difference of 0.86%), Immigrants from Jamaica (8.4%, a difference of 1.3%), and Immigrants from Caribbean (8.4%, a difference of 1.5%).
| Demographics | Rating | Rank | Single Mother Households |
| Bahamians | 0.0 /100 | #320 | Tragic 8.3% |
| Immigrants | Senegal | 0.0 /100 | #321 | Tragic 8.3% |
| Pima | 0.0 /100 | #322 | Tragic 8.3% |
| Haitians | 0.0 /100 | #323 | Tragic 8.3% |
| Immigrants | Jamaica | 0.0 /100 | #324 | Tragic 8.4% |
| Immigrants | Caribbean | 0.0 /100 | #325 | Tragic 8.4% |
| British West Indians | 0.0 /100 | #326 | Tragic 8.4% |
| Immigrants | Haiti | 0.0 /100 | #327 | Tragic 8.4% |
| Yakama | 0.0 /100 | #328 | Tragic 8.4% |
| Hopi | 0.0 /100 | #329 | Tragic 8.5% |
| Inupiat | 0.0 /100 | #330 | Tragic 8.5% |
| Sioux | 0.0 /100 | #331 | Tragic 8.5% |
| U.S. Virgin Islanders | 0.0 /100 | #332 | Tragic 8.6% |
| Liberians | 0.0 /100 | #333 | Tragic 8.6% |
| Immigrants | Liberia | 0.0 /100 | #334 | Tragic 8.7% |
| Immigrants | Dominica | 0.0 /100 | #335 | Tragic 8.7% |
| Puerto Ricans | 0.0 /100 | #336 | Tragic 8.7% |
| Navajo | 0.0 /100 | #337 | Tragic 8.8% |
| Cape Verdeans | 0.0 /100 | #338 | Tragic 8.9% |
| Blacks/African Americans | 0.0 /100 | #339 | Tragic 9.0% |
| Lumbee | 0.0 /100 | #340 | Tragic 9.1% |