Lithuanian vs U.S. Virgin Islander Currently Married
COMPARE
Lithuanian
U.S. Virgin Islander
Currently Married
Currently Married Comparison
Lithuanians
U.S. Virgin Islanders
49.0%
CURRENTLY MARRIED
99.6/ 100
METRIC RATING
24th/ 347
METRIC RANK
40.7%
CURRENTLY MARRIED
0.0/ 100
METRIC RATING
325th/ 347
METRIC RANK
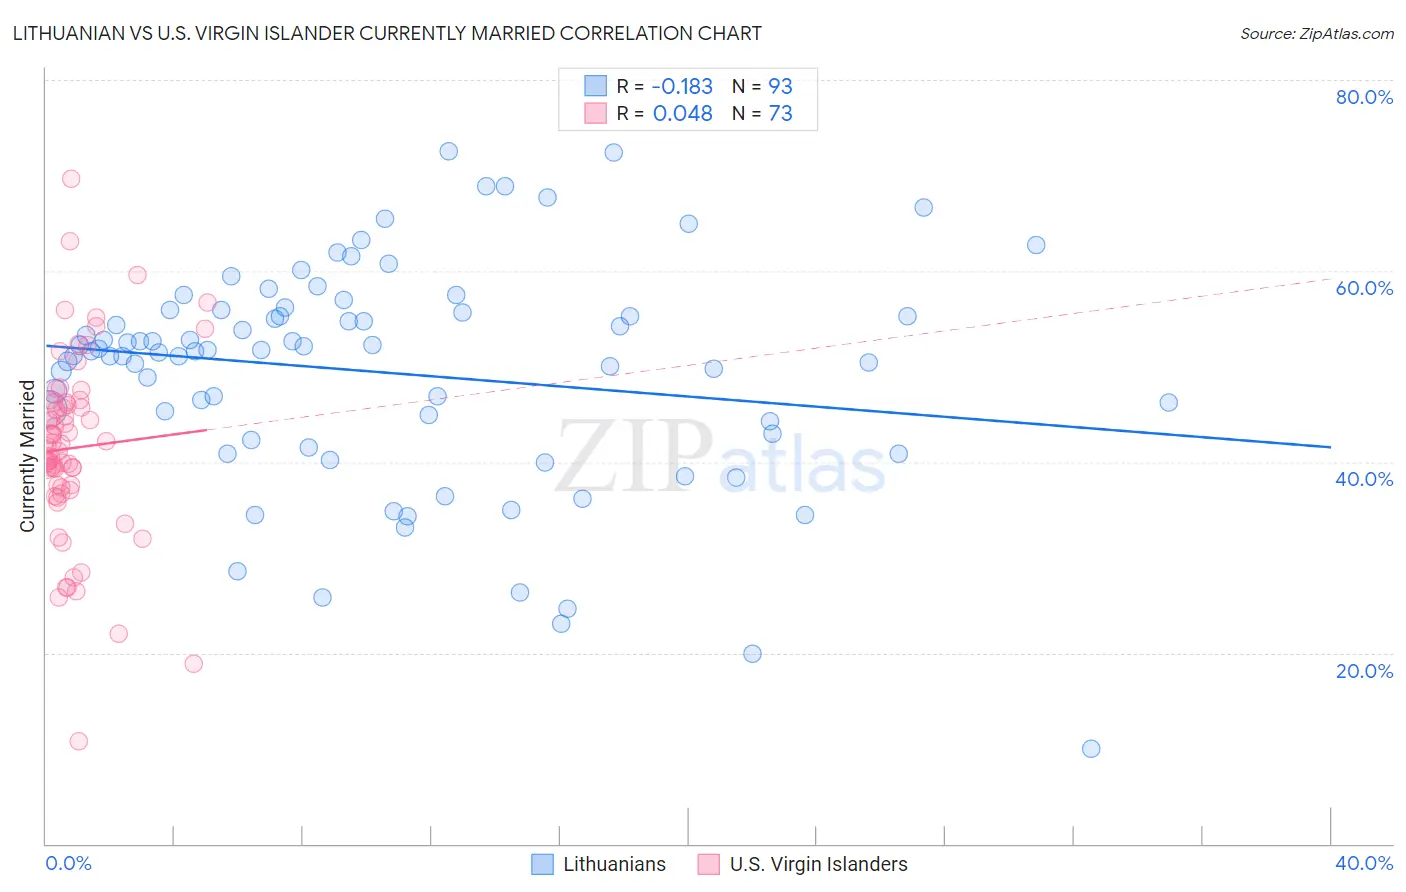
Lithuanian vs U.S. Virgin Islander Currently Married Correlation Chart
The statistical analysis conducted on geographies consisting of 421,888,546 people shows a poor negative correlation between the proportion of Lithuanians and percentage of population currently married in the United States with a correlation coefficient (R) of -0.183 and weighted average of 49.0%. Similarly, the statistical analysis conducted on geographies consisting of 87,525,763 people shows no correlation between the proportion of U.S. Virgin Islanders and percentage of population currently married in the United States with a correlation coefficient (R) of 0.048 and weighted average of 40.7%, a difference of 20.4%.
Currently Married Correlation Summary
| Measurement | Lithuanian | U.S. Virgin Islander |
| Minimum | 10.0% | 10.7% |
| Maximum | 72.5% | 69.6% |
| Range | 62.5% | 58.9% |
| Mean | 49.3% | 41.5% |
| Median | 51.6% | 41.7% |
| Interquartile 25% (IQ1) | 42.6% | 37.2% |
| Interquartile 75% (IQ3) | 55.8% | 46.2% |
| Interquartile Range (IQR) | 13.2% | 9.0% |
| Standard Deviation (Sample) | 11.7% | 9.8% |
| Standard Deviation (Population) | 11.7% | 9.7% |
Similar Demographics by Currently Married
Demographics Similar to Lithuanians by Currently Married
In terms of currently married, the demographic groups most similar to Lithuanians are Maltese (49.0%, a difference of 0.010%), Immigrants from Korea (49.0%, a difference of 0.060%), Immigrants from Pakistan (49.1%, a difference of 0.11%), Burmese (48.9%, a difference of 0.13%), and Welsh (48.9%, a difference of 0.17%).
| Demographics | Rating | Rank | Currently Married |
| Scandinavians | 99.9 /100 | #17 | Exceptional 49.5% |
| Immigrants | Scotland | 99.8 /100 | #18 | Exceptional 49.3% |
| Europeans | 99.8 /100 | #19 | Exceptional 49.3% |
| Luxembourgers | 99.8 /100 | #20 | Exceptional 49.3% |
| Scottish | 99.8 /100 | #21 | Exceptional 49.2% |
| Bulgarians | 99.7 /100 | #22 | Exceptional 49.1% |
| Immigrants | Pakistan | 99.7 /100 | #23 | Exceptional 49.1% |
| Lithuanians | 99.6 /100 | #24 | Exceptional 49.0% |
| Maltese | 99.6 /100 | #25 | Exceptional 49.0% |
| Immigrants | Korea | 99.6 /100 | #26 | Exceptional 49.0% |
| Burmese | 99.6 /100 | #27 | Exceptional 48.9% |
| Welsh | 99.5 /100 | #28 | Exceptional 48.9% |
| Croatians | 99.5 /100 | #29 | Exceptional 48.9% |
| Eastern Europeans | 99.5 /100 | #30 | Exceptional 48.9% |
| Poles | 99.5 /100 | #31 | Exceptional 48.9% |
Demographics Similar to U.S. Virgin Islanders by Currently Married
In terms of currently married, the demographic groups most similar to U.S. Virgin Islanders are Immigrants from Senegal (40.7%, a difference of 0.050%), Immigrants from West Indies (40.7%, a difference of 0.060%), Barbadian (40.6%, a difference of 0.14%), Senegalese (40.6%, a difference of 0.31%), and Arapaho (40.5%, a difference of 0.35%).
| Demographics | Rating | Rank | Currently Married |
| Bahamians | 0.0 /100 | #318 | Tragic 41.2% |
| Immigrants | Somalia | 0.0 /100 | #319 | Tragic 41.2% |
| Immigrants | Jamaica | 0.0 /100 | #320 | Tragic 41.1% |
| Immigrants | Congo | 0.0 /100 | #321 | Tragic 41.1% |
| Immigrants | Haiti | 0.0 /100 | #322 | Tragic 41.0% |
| Immigrants | West Indies | 0.0 /100 | #323 | Tragic 40.7% |
| Immigrants | Senegal | 0.0 /100 | #324 | Tragic 40.7% |
| U.S. Virgin Islanders | 0.0 /100 | #325 | Tragic 40.7% |
| Barbadians | 0.0 /100 | #326 | Tragic 40.6% |
| Senegalese | 0.0 /100 | #327 | Tragic 40.6% |
| Arapaho | 0.0 /100 | #328 | Tragic 40.5% |
| Crow | 0.0 /100 | #329 | Tragic 40.4% |
| Immigrants | Dominica | 0.0 /100 | #330 | Tragic 40.3% |
| Immigrants | Barbados | 0.0 /100 | #331 | Tragic 40.3% |
| Immigrants | St. Vincent and the Grenadines | 0.0 /100 | #332 | Tragic 40.1% |