Lebanese vs Immigrants from Vietnam Divorced or Separated
COMPARE
Lebanese
Immigrants from Vietnam
Divorced or Separated
Divorced or Separated Comparison
Lebanese
Immigrants from Vietnam
11.9%
DIVORCED OR SEPARATED
83.4/ 100
METRIC RATING
140th/ 347
METRIC RANK
11.3%
DIVORCED OR SEPARATED
99.9/ 100
METRIC RATING
57th/ 347
METRIC RANK
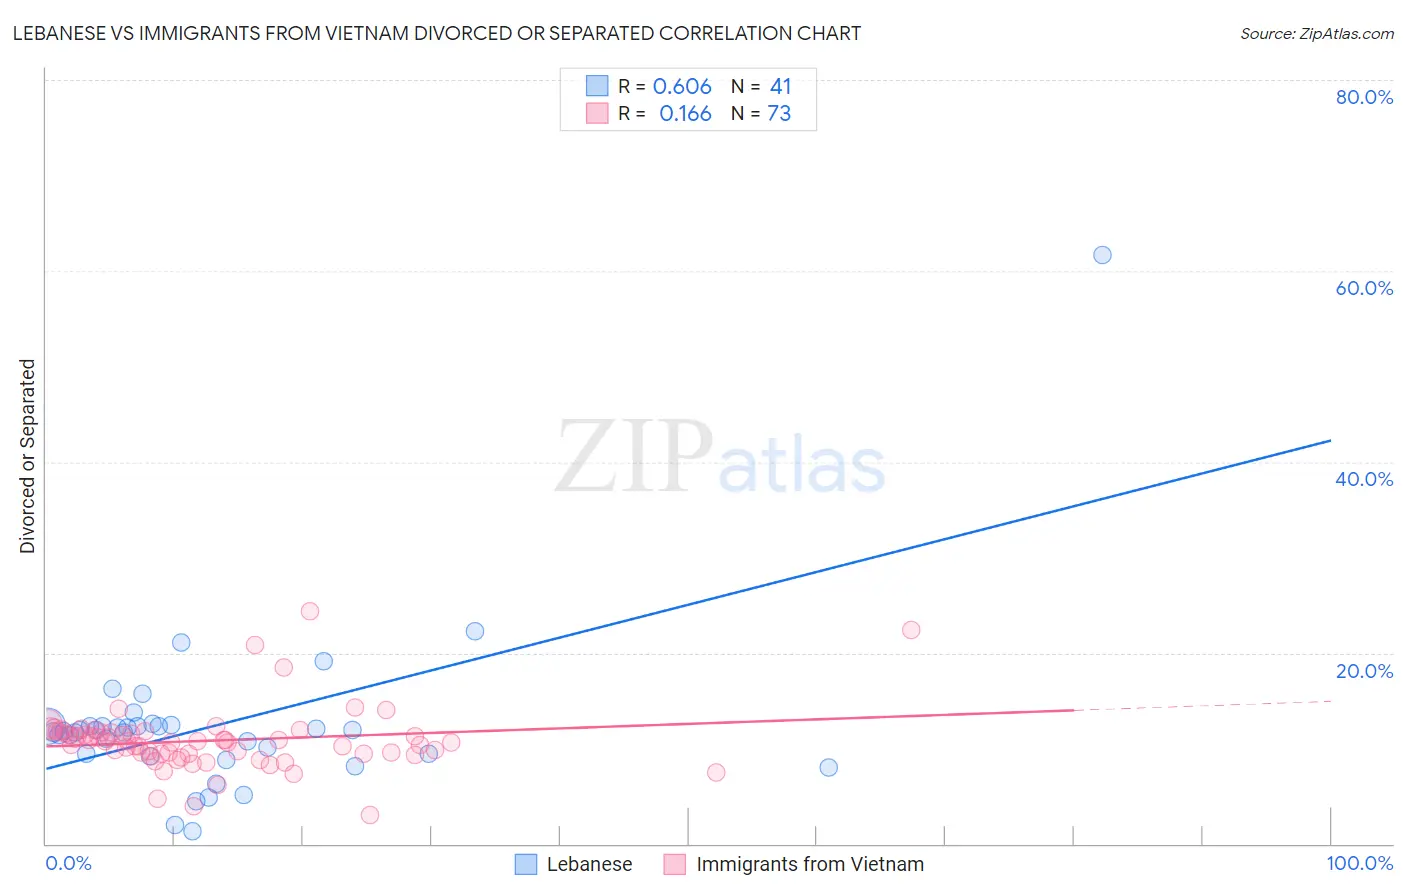
Lebanese vs Immigrants from Vietnam Divorced or Separated Correlation Chart
The statistical analysis conducted on geographies consisting of 401,417,076 people shows a significant positive correlation between the proportion of Lebanese and percentage of population currently divorced or separated in the United States with a correlation coefficient (R) of 0.606 and weighted average of 11.9%. Similarly, the statistical analysis conducted on geographies consisting of 404,667,518 people shows a poor positive correlation between the proportion of Immigrants from Vietnam and percentage of population currently divorced or separated in the United States with a correlation coefficient (R) of 0.166 and weighted average of 11.3%, a difference of 5.1%.
Divorced or Separated Correlation Summary
| Measurement | Lebanese | Immigrants from Vietnam |
| Minimum | 1.3% | 3.0% |
| Maximum | 61.7% | 24.3% |
| Range | 60.4% | 21.3% |
| Mean | 12.4% | 10.8% |
| Median | 11.8% | 10.7% |
| Interquartile 25% (IQ1) | 9.2% | 9.4% |
| Interquartile 75% (IQ3) | 12.3% | 11.7% |
| Interquartile Range (IQR) | 3.1% | 2.3% |
| Standard Deviation (Sample) | 9.0% | 3.3% |
| Standard Deviation (Population) | 8.9% | 3.3% |
Similar Demographics by Divorced or Separated
Demographics Similar to Lebanese by Divorced or Separated
In terms of divorced or separated, the demographic groups most similar to Lebanese are Australian (11.9%, a difference of 0.020%), Immigrants from Netherlands (11.9%, a difference of 0.030%), Immigrants from Morocco (11.9%, a difference of 0.030%), Alsatian (11.9%, a difference of 0.040%), and Carpatho Rusyn (11.9%, a difference of 0.090%).
| Demographics | Rating | Rank | Divorced or Separated |
| New Zealanders | 87.5 /100 | #133 | Excellent 11.9% |
| Argentineans | 85.1 /100 | #134 | Excellent 11.9% |
| Danes | 84.8 /100 | #135 | Excellent 11.9% |
| Carpatho Rusyns | 84.8 /100 | #136 | Excellent 11.9% |
| Alsatians | 84.0 /100 | #137 | Excellent 11.9% |
| Immigrants | Netherlands | 83.9 /100 | #138 | Excellent 11.9% |
| Australians | 83.6 /100 | #139 | Excellent 11.9% |
| Lebanese | 83.4 /100 | #140 | Excellent 11.9% |
| Immigrants | Morocco | 82.9 /100 | #141 | Excellent 11.9% |
| Immigrants | Zimbabwe | 81.5 /100 | #142 | Excellent 11.9% |
| Pakistanis | 81.3 /100 | #143 | Excellent 11.9% |
| Peruvians | 80.9 /100 | #144 | Excellent 11.9% |
| Croatians | 80.6 /100 | #145 | Excellent 11.9% |
| Immigrants | Grenada | 79.1 /100 | #146 | Good 11.9% |
| Poles | 78.6 /100 | #147 | Good 11.9% |
Demographics Similar to Immigrants from Vietnam by Divorced or Separated
In terms of divorced or separated, the demographic groups most similar to Immigrants from Vietnam are Immigrants from Philippines (11.3%, a difference of 0.010%), Sri Lankan (11.3%, a difference of 0.060%), Immigrants from Yemen (11.3%, a difference of 0.070%), Eastern European (11.3%, a difference of 0.080%), and Israeli (11.3%, a difference of 0.16%).
| Demographics | Rating | Rank | Divorced or Separated |
| Bolivians | 100.0 /100 | #50 | Exceptional 11.2% |
| Immigrants | Bolivia | 100.0 /100 | #51 | Exceptional 11.3% |
| Immigrants | Australia | 99.9 /100 | #52 | Exceptional 11.3% |
| Immigrants | Lithuania | 99.9 /100 | #53 | Exceptional 11.3% |
| Eastern Europeans | 99.9 /100 | #54 | Exceptional 11.3% |
| Immigrants | Yemen | 99.9 /100 | #55 | Exceptional 11.3% |
| Immigrants | Philippines | 99.9 /100 | #56 | Exceptional 11.3% |
| Immigrants | Vietnam | 99.9 /100 | #57 | Exceptional 11.3% |
| Sri Lankans | 99.9 /100 | #58 | Exceptional 11.3% |
| Israelis | 99.9 /100 | #59 | Exceptional 11.3% |
| Immigrants | Russia | 99.9 /100 | #60 | Exceptional 11.3% |
| Koreans | 99.9 /100 | #61 | Exceptional 11.3% |
| Luxembourgers | 99.9 /100 | #62 | Exceptional 11.3% |
| Immigrants | Kuwait | 99.9 /100 | #63 | Exceptional 11.3% |
| Macedonians | 99.8 /100 | #64 | Exceptional 11.4% |