Immigrants from South America vs Immigrants from Vietnam Per Capita Income
COMPARE
Immigrants from South America
Immigrants from Vietnam
Per Capita Income
Per Capita Income Comparison
Immigrants from South America
Immigrants from Vietnam
$44,068
PER CAPITA INCOME
61.2/ 100
METRIC RATING
163rd/ 347
METRIC RANK
$43,229
PER CAPITA INCOME
38.1/ 100
METRIC RATING
182nd/ 347
METRIC RANK
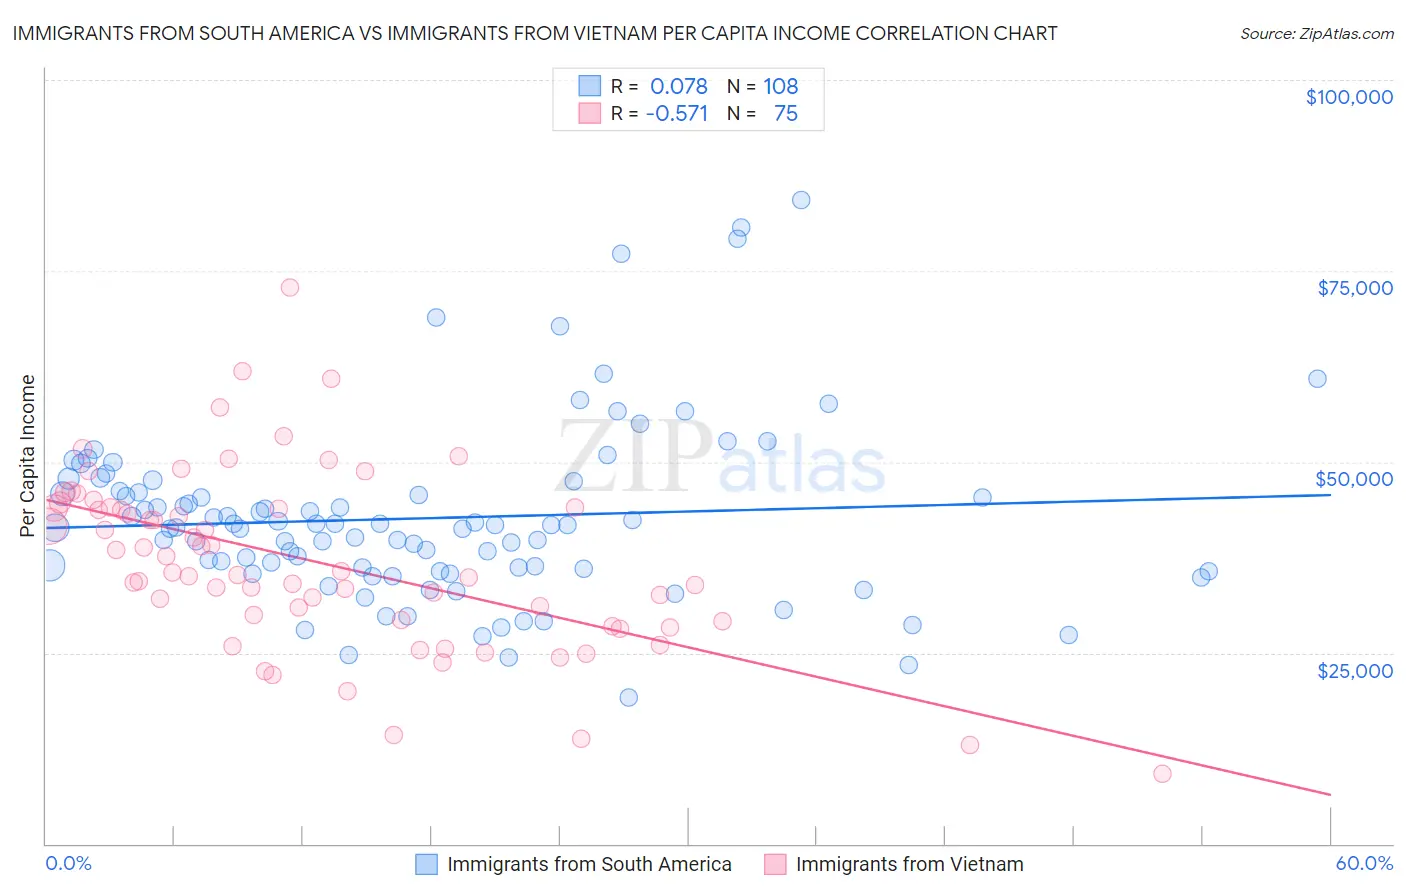
Immigrants from South America vs Immigrants from Vietnam Per Capita Income Correlation Chart
The statistical analysis conducted on geographies consisting of 486,454,612 people shows a slight positive correlation between the proportion of Immigrants from South America and per capita income in the United States with a correlation coefficient (R) of 0.078 and weighted average of $44,068. Similarly, the statistical analysis conducted on geographies consisting of 404,854,816 people shows a substantial negative correlation between the proportion of Immigrants from Vietnam and per capita income in the United States with a correlation coefficient (R) of -0.571 and weighted average of $43,229, a difference of 1.9%.
Per Capita Income Correlation Summary
| Measurement | Immigrants from South America | Immigrants from Vietnam |
| Minimum | $19,195 | $9,224 |
| Maximum | $84,313 | $72,882 |
| Range | $65,118 | $63,658 |
| Mean | $42,614 | $36,916 |
| Median | $41,568 | $35,508 |
| Interquartile 25% (IQ1) | $35,887 | $29,060 |
| Interquartile 75% (IQ3) | $46,069 | $44,032 |
| Interquartile Range (IQR) | $10,183 | $14,972 |
| Standard Deviation (Sample) | $11,625 | $11,678 |
| Standard Deviation (Population) | $11,572 | $11,600 |
Demographics Similar to Immigrants from South America and Immigrants from Vietnam by Per Capita Income
In terms of per capita income, the demographic groups most similar to Immigrants from South America are Swiss ($44,076, a difference of 0.020%), Sri Lankan ($44,014, a difference of 0.12%), Immigrants from Philippines ($44,000, a difference of 0.15%), Immigrants from Uruguay ($43,997, a difference of 0.16%), and English ($43,982, a difference of 0.19%). Similarly, the demographic groups most similar to Immigrants from Vietnam are Welsh ($43,233, a difference of 0.010%), Sierra Leonean ($43,405, a difference of 0.41%), Immigrants from Costa Rica ($43,464, a difference of 0.54%), Finnish ($43,461, a difference of 0.54%), and Tlingit-Haida ($43,516, a difference of 0.66%).
| Demographics | Rating | Rank | Per Capita Income |
| Swiss | 61.4 /100 | #162 | Good $44,076 |
| Immigrants | South America | 61.2 /100 | #163 | Good $44,068 |
| Sri Lankans | 59.8 /100 | #164 | Average $44,014 |
| Immigrants | Philippines | 59.4 /100 | #165 | Average $44,000 |
| Immigrants | Uruguay | 59.3 /100 | #166 | Average $43,997 |
| English | 58.9 /100 | #167 | Average $43,982 |
| Belgians | 58.1 /100 | #168 | Average $43,951 |
| Immigrants | Peru | 55.3 /100 | #169 | Average $43,852 |
| Scandinavians | 55.2 /100 | #170 | Average $43,848 |
| Immigrants | Eastern Africa | 54.9 /100 | #171 | Average $43,838 |
| Czechoslovakians | 54.1 /100 | #172 | Average $43,806 |
| French | 50.7 /100 | #173 | Average $43,685 |
| Colombians | 50.0 /100 | #174 | Average $43,661 |
| Celtics | 48.9 /100 | #175 | Average $43,621 |
| Immigrants | South Eastern Asia | 46.6 /100 | #176 | Average $43,539 |
| Tlingit-Haida | 45.9 /100 | #177 | Average $43,516 |
| Immigrants | Costa Rica | 44.5 /100 | #178 | Average $43,464 |
| Finns | 44.4 /100 | #179 | Average $43,461 |
| Sierra Leoneans | 42.9 /100 | #180 | Average $43,405 |
| Welsh | 38.2 /100 | #181 | Fair $43,233 |
| Immigrants | Vietnam | 38.1 /100 | #182 | Fair $43,229 |