Dutch vs Immigrants from Vietnam Per Capita Income
COMPARE
Dutch
Immigrants from Vietnam
Per Capita Income
Per Capita Income Comparison
Dutch
Immigrants from Vietnam
$42,605
PER CAPITA INCOME
23.4/ 100
METRIC RATING
196th/ 347
METRIC RANK
$43,229
PER CAPITA INCOME
38.1/ 100
METRIC RATING
182nd/ 347
METRIC RANK
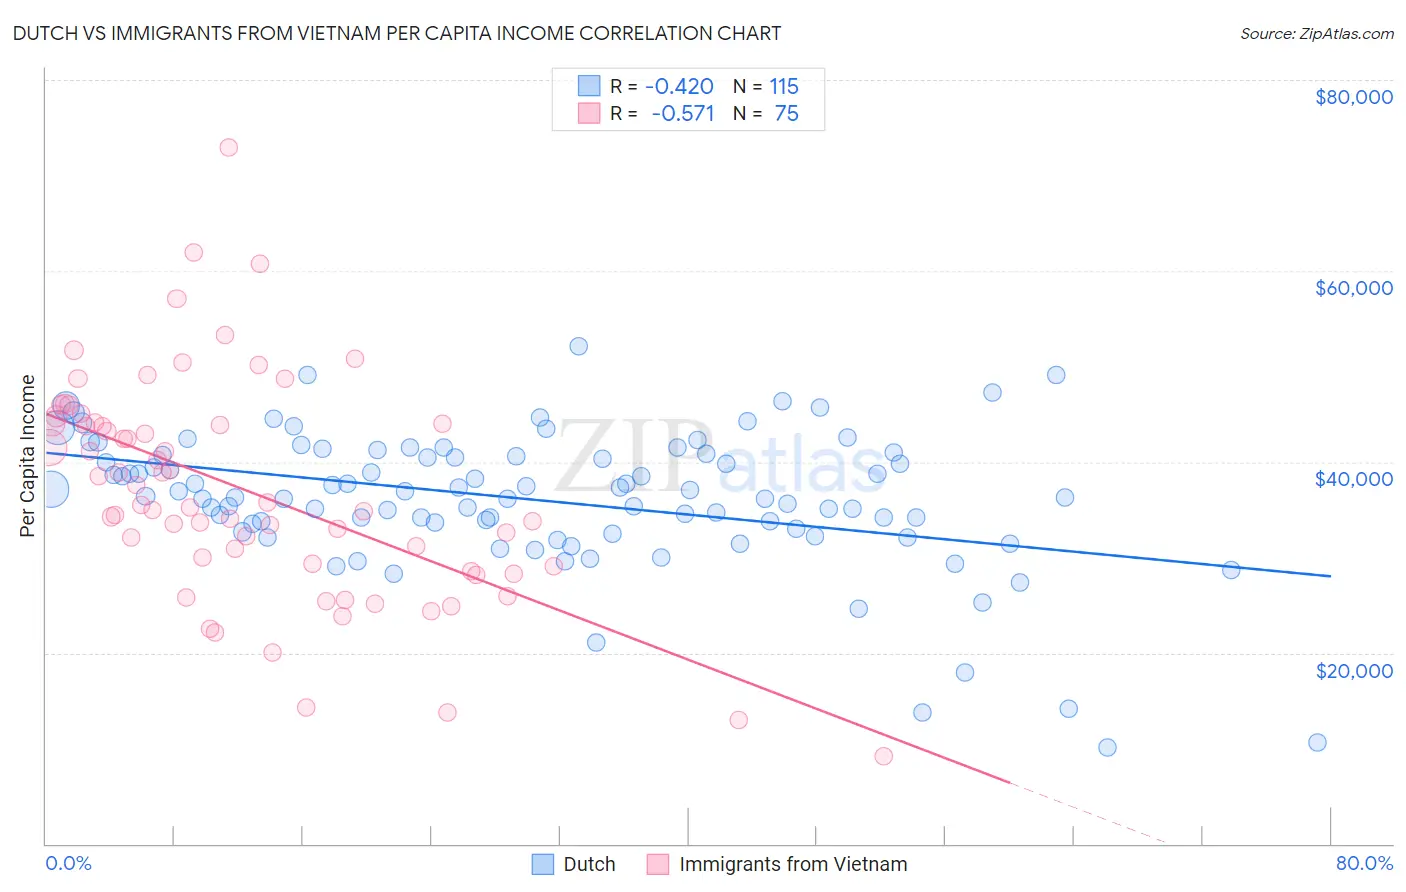
Dutch vs Immigrants from Vietnam Per Capita Income Correlation Chart
The statistical analysis conducted on geographies consisting of 554,404,949 people shows a moderate negative correlation between the proportion of Dutch and per capita income in the United States with a correlation coefficient (R) of -0.420 and weighted average of $42,605. Similarly, the statistical analysis conducted on geographies consisting of 404,854,816 people shows a substantial negative correlation between the proportion of Immigrants from Vietnam and per capita income in the United States with a correlation coefficient (R) of -0.571 and weighted average of $43,229, a difference of 1.5%.
Per Capita Income Correlation Summary
| Measurement | Dutch | Immigrants from Vietnam |
| Minimum | $10,108 | $9,224 |
| Maximum | $52,150 | $72,882 |
| Range | $42,042 | $63,658 |
| Mean | $36,061 | $36,916 |
| Median | $36,441 | $35,508 |
| Interquartile 25% (IQ1) | $33,045 | $29,060 |
| Interquartile 75% (IQ3) | $40,758 | $44,032 |
| Interquartile Range (IQR) | $7,713 | $14,972 |
| Standard Deviation (Sample) | $7,274 | $11,678 |
| Standard Deviation (Population) | $7,242 | $11,600 |
Demographics Similar to Dutch and Immigrants from Vietnam by Per Capita Income
In terms of per capita income, the demographic groups most similar to Dutch are Scotch-Irish ($42,563, a difference of 0.10%), Immigrants from Kenya ($42,661, a difference of 0.13%), Immigrants from Fiji ($42,694, a difference of 0.21%), Immigrants from Sierra Leone ($42,752, a difference of 0.34%), and Iraqi ($42,760, a difference of 0.36%). Similarly, the demographic groups most similar to Immigrants from Vietnam are Welsh ($43,233, a difference of 0.010%), German ($43,067, a difference of 0.38%), Sierra Leonean ($43,405, a difference of 0.41%), Spaniard ($43,028, a difference of 0.47%), and Immigrants ($43,010, a difference of 0.51%).
| Demographics | Rating | Rank | Per Capita Income |
| Finns | 44.4 /100 | #179 | Average $43,461 |
| Sierra Leoneans | 42.9 /100 | #180 | Average $43,405 |
| Welsh | 38.2 /100 | #181 | Fair $43,233 |
| Immigrants | Vietnam | 38.1 /100 | #182 | Fair $43,229 |
| Germans | 33.9 /100 | #183 | Fair $43,067 |
| Spaniards | 32.9 /100 | #184 | Fair $43,028 |
| Immigrants | Immigrants | 32.5 /100 | #185 | Fair $43,010 |
| French Canadians | 32.3 /100 | #186 | Fair $43,003 |
| Immigrants | Colombia | 31.5 /100 | #187 | Fair $42,971 |
| Immigrants | Africa | 31.0 /100 | #188 | Fair $42,950 |
| Bermudans | 30.1 /100 | #189 | Fair $42,911 |
| Kenyans | 27.7 /100 | #190 | Fair $42,808 |
| Yugoslavians | 27.4 /100 | #191 | Fair $42,792 |
| Iraqis | 26.7 /100 | #192 | Fair $42,760 |
| Immigrants | Sierra Leone | 26.5 /100 | #193 | Fair $42,752 |
| Immigrants | Fiji | 25.2 /100 | #194 | Fair $42,694 |
| Immigrants | Kenya | 24.5 /100 | #195 | Fair $42,661 |
| Dutch | 23.4 /100 | #196 | Fair $42,605 |
| Scotch-Irish | 22.6 /100 | #197 | Fair $42,563 |
| Immigrants | Portugal | 19.7 /100 | #198 | Poor $42,412 |
| Barbadians | 19.6 /100 | #199 | Poor $42,406 |