Colombian vs Immigrants from Vietnam Per Capita Income

COMPARE

Colombian
Race
Ancestry
AfghanAfricanAlaska NativeAlaskan AthabascanAlbanianAleutAlsatianAmericanApacheArabArapahoArgentineanArmenianAssyrian/Chaldean/SyriacAustralianAustrianBahamianBangladeshiBarbadianBasqueBelgianBelizeanBermudanBhutaneseBlackfeetBolivianBrazilianBritishBritish West IndianBulgarianBurmeseCajunCambodianCanadianCape VerdeanCarpatho RusynCelticCentral AmericanCentral American IndianCherokeeCheyenneChickasawChileanChineseChippewaChoctawColombianColvilleComancheCosta RicanCreeCreekCroatianCrowCubanCypriotCzechCzechoslovakianDanishDelawareDominicanDutchDutch West IndianEastern EuropeanEcuadorianEgyptianEnglishEstonianEthiopianEuropeanFijianFilipinoFinnishFrenchFrench American IndianFrench CanadianGermanGerman RussianGhanaianGreekGuamanian/ChamorroGuatemalanGuyaneseHaitianHmongHonduranHopiHoumaHungarianIcelanderIndian (Asian)IndonesianInupiatIranianIraqiIrishIroquoisIsraeliItalianJamaicanJapaneseJordanianKenyanKiowaKoreanLaotianLatvianLebaneseLiberianLithuanianLumbeeLuxembourgerMacedonianMalaysianMalteseMarshalleseMenomineeMexicanMexican American IndianMongolianMoroccanNative HawaiianNavajoNepaleseNew ZealanderNicaraguanNigerianNorthern EuropeanNorwegianOkinawanOsageOttawaPaiutePakistaniPalestinianPanamanianParaguayanPennsylvania GermanPeruvianPimaPolishPortuguesePotawatomiPuebloPuerto RicanPuget Sound SalishRomanianRussianSalvadoranSamoanScandinavianScotch-IrishScottishSeminoleSenegaleseSerbianShoshoneSierra LeoneanSiouxSlavicSlovakSloveneSomaliSouth AfricanSouth AmericanSouth American IndianSoviet UnionSpaniardSpanishSpanish AmericanSpanish American IndianSri LankanSubsaharan AfricanSudaneseSwedishSwissSyrianTaiwaneseThaiTlingit-HaidaTohono O'OdhamTonganTrinidadian and TobagonianTsimshianTurkishU.S. Virgin IslanderUgandanUkrainianUruguayanUteVenezuelanVietnameseWelshWest IndianYakamaYaquiYugoslavianYumanYup'ikZimbabwean
Immigration
NonimmigrantsImmigrantsAfghanistanAfricaAlbaniaArgentinaArmeniaAsiaAustraliaAustriaBahamasBangladeshBarbadosBelarusBelgiumBelizeBoliviaBosnia and HerzegovinaBrazilBulgariaBurma/MyanmarCabo VerdeCambodiaCameroonCanadaCaribbeanCentral AmericaChileChinaColombiaCongoCosta RicaCroatiaCubaCzechoslovakiaDenmarkDominicaDominican RepublicEastern AfricaEastern AsiaEastern EuropeEcuadorEgyptEl SalvadorEnglandEritreaEthiopiaEuropeFijiFranceGermanyGhanaGreeceGrenadaGuatemalaGuyanaHaitiHondurasHong KongHungaryIndiaIndonesiaIranIraqIrelandIsraelItalyJamaicaJapanJordanKazakhstanKenyaKoreaKuwaitLaosLatin AmericaLatviaLebanonLiberiaLithuaniaMalaysiaMexicoMicronesiaMiddle AfricaMoldovaMoroccoNepalNetherlandsNicaraguaNigeriaNorth AmericaNorth MacedoniaNorthern AfricaNorthern EuropeNorwayOceaniaPakistanPanamaPeruPhilippinesPolandPortugalRomaniaRussiaSaudi ArabiaScotlandSenegalSerbiaSierra LeoneSingaporeSomaliaSouth AfricaSouth AmericaSouth Central AsiaSouth Eastern AsiaSouthern EuropeSpainSri LankaSt. Vincent and the GrenadinesSudanSwedenSwitzerlandSyriaTaiwanThailandTrinidad and TobagoTurkeyUgandaUkraineUruguayUzbekistanVenezuelaWest IndiesWestern AfricaWestern AsiaWestern EuropeYemenZaireZimbabweAzores
Immigrants from Vietnam
Race
Ancestry
AfghanAfricanAlaska NativeAlaskan AthabascanAlbanianAleutAlsatianAmericanApacheArabArapahoArgentineanArmenianAssyrian/Chaldean/SyriacAustralianAustrianBahamianBangladeshiBarbadianBasqueBelgianBelizeanBermudanBhutaneseBlackfeetBolivianBrazilianBritishBritish West IndianBulgarianBurmeseCajunCambodianCanadianCape VerdeanCarpatho RusynCelticCentral AmericanCentral American IndianCherokeeCheyenneChickasawChileanChineseChippewaChoctawColvilleComancheCosta RicanCreeCreekCroatianCrowCubanCypriotCzechCzechoslovakianDanishDelawareDominicanDutchDutch West IndianEastern EuropeanEcuadorianEgyptianEnglishEstonianEthiopianEuropeanFijianFilipinoFinnishFrenchFrench American IndianFrench CanadianGermanGerman RussianGhanaianGreekGuamanian/ChamorroGuatemalanGuyaneseHaitianHmongHonduranHopiHoumaHungarianIcelanderIndian (Asian)IndonesianInupiatIranianIraqiIrishIroquoisIsraeliItalianJamaicanJapaneseJordanianKenyanKiowaKoreanLaotianLatvianLebaneseLiberianLithuanianLumbeeLuxembourgerMacedonianMalaysianMalteseMarshalleseMenomineeMexicanMexican American IndianMongolianMoroccanNative HawaiianNavajoNepaleseNew ZealanderNicaraguanNigerianNorthern EuropeanNorwegianOkinawanOsageOttawaPaiutePakistaniPalestinianPanamanianParaguayanPennsylvania GermanPeruvianPimaPolishPortuguesePotawatomiPuebloPuerto RicanPuget Sound SalishRomanianRussianSalvadoranSamoanScandinavianScotch-IrishScottishSeminoleSenegaleseSerbianShoshoneSierra LeoneanSiouxSlavicSlovakSloveneSomaliSouth AfricanSouth AmericanSouth American IndianSoviet UnionSpaniardSpanishSpanish AmericanSpanish American IndianSri LankanSubsaharan AfricanSudaneseSwedishSwissSyrianTaiwaneseThaiTlingit-HaidaTohono O'OdhamTonganTrinidadian and TobagonianTsimshianTurkishU.S. Virgin IslanderUgandanUkrainianUruguayanUteVenezuelanVietnameseWelshWest IndianYakamaYaquiYugoslavianYumanYup'ikZimbabwean
Immigration
NonimmigrantsImmigrantsAfghanistanAfricaAlbaniaArgentinaArmeniaAsiaAustraliaAustriaBahamasBangladeshBarbadosBelarusBelgiumBelizeBoliviaBosnia and HerzegovinaBrazilBulgariaBurma/MyanmarCabo VerdeCambodiaCameroonCanadaCaribbeanCentral AmericaChileChinaColombiaCongoCosta RicaCroatiaCubaCzechoslovakiaDenmarkDominicaDominican RepublicEastern AfricaEastern AsiaEastern EuropeEcuadorEgyptEl SalvadorEnglandEritreaEthiopiaEuropeFijiFranceGermanyGhanaGreeceGrenadaGuatemalaGuyanaHaitiHondurasHong KongHungaryIndiaIndonesiaIranIraqIrelandIsraelItalyJamaicaJapanJordanKazakhstanKenyaKoreaKuwaitLaosLatin AmericaLatviaLebanonLiberiaLithuaniaMalaysiaMexicoMicronesiaMiddle AfricaMoldovaMoroccoNepalNetherlandsNicaraguaNigeriaNorth AmericaNorth MacedoniaNorthern AfricaNorthern EuropeNorwayOceaniaPakistanPanamaPeruPhilippinesPolandPortugalRomaniaRussiaSaudi ArabiaScotlandSenegalSerbiaSierra LeoneSingaporeSomaliaSouth AfricaSouth AmericaSouth Central AsiaSouth Eastern AsiaSouthern EuropeSpainSri LankaSt. Vincent and the GrenadinesSudanSwedenSwitzerlandSyriaTaiwanThailandTrinidad and TobagoTurkeyUgandaUkraineUruguayUzbekistanVenezuelaVietnamWest IndiesWestern AfricaWestern AsiaWestern EuropeYemenZaireZimbabweAzores
Per Capita Income
Income
Poverty
Unemployment
Labor Participation
Family Structure
Vehicle Availability
Education Level
Disability

Per Capita Income Comparison

Colombians

Immigrants from Vietnam

Average
Fair
$43,661
PER CAPITA INCOME
50.0/ 100
METRIC RATING
174th/ 347
METRIC RANK
$43,229
PER CAPITA INCOME
38.1/ 100
METRIC RATING
182nd/ 347
METRIC RANK

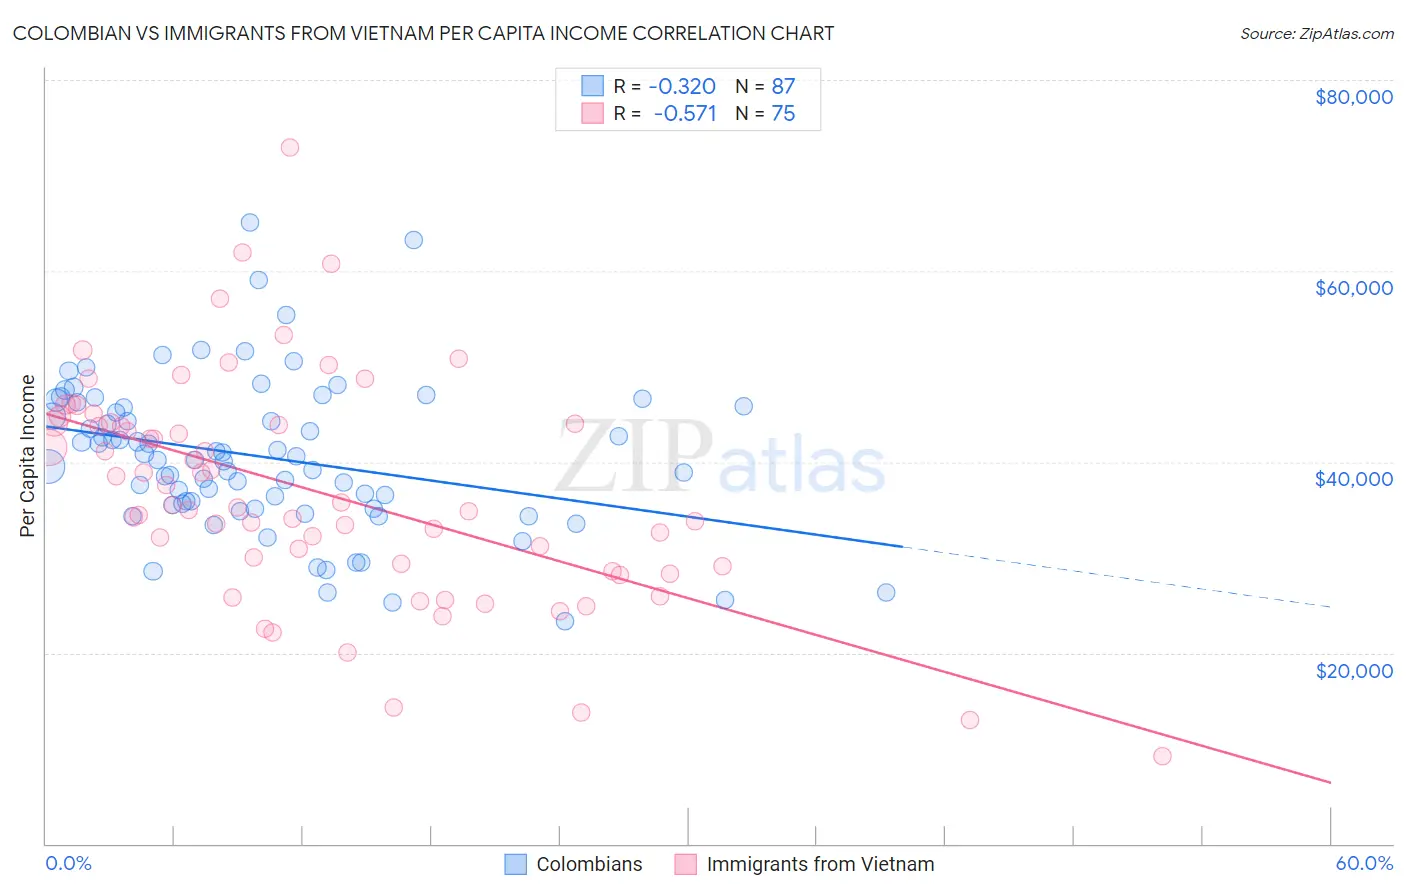
Colombian vs Immigrants from Vietnam Per Capita Income Correlation Chart

The statistical analysis conducted on geographies consisting of 419,718,902 people shows a mild negative correlation between the proportion of Colombians and per capita income in the United States with a correlation coefficient (R) of -0.320 and weighted average of $43,661. Similarly, the statistical analysis conducted on geographies consisting of 404,854,816 people shows a substantial negative correlation between the proportion of Immigrants from Vietnam and per capita income in the United States with a correlation coefficient (R) of -0.571 and weighted average of $43,229, a difference of 1.0%.
Colombian vs Immigrants from Vietnam Per Capita Income

Per Capita Income Correlation Summary

MeasurementColombianImmigrants from Vietnam
Minimum$23,272$9,224
Maximum$65,011$72,882
Range$41,739$63,658
Mean$40,509$36,916
Median$40,249$35,508
Interquartile 25% (IQ1)$35,498$29,060
Interquartile 75% (IQ3)$45,774$44,032
Interquartile Range (IQR)$10,276$14,972
Standard Deviation (Sample)$7,993$11,678
Standard Deviation (Population)$7,947$11,600

Demographics Similar to Colombians and Immigrants from Vietnam by Per Capita Income

In terms of per capita income, the demographic groups most similar to Colombians are French ($43,685, a difference of 0.060%), Celtic ($43,621, a difference of 0.090%), Immigrants from South Eastern Asia ($43,539, a difference of 0.28%), Czechoslovakian ($43,806, a difference of 0.33%), and Tlingit-Haida ($43,516, a difference of 0.33%). Similarly, the demographic groups most similar to Immigrants from Vietnam are Welsh ($43,233, a difference of 0.010%), German ($43,067, a difference of 0.38%), Sierra Leonean ($43,405, a difference of 0.41%), Spaniard ($43,028, a difference of 0.47%), and Immigrants ($43,010, a difference of 0.51%).
DemographicsRating | RankPer Capita Income
Belgians
58.1
/100
|
#168
Average
$43,951
Immigrants | Peru
55.3
/100
|
#169
Average
$43,852
Scandinavians
55.2
/100
|
#170
Average
$43,848
Immigrants | Eastern Africa
54.9
/100
|
#171
Average
$43,838
Czechoslovakians
54.1
/100
|
#172
Average
$43,806
French
50.7
/100
|
#173
Average
$43,685
Colombians
50.0
/100
|
#174
Average
$43,661
Celtics
48.9
/100
|
#175
Average
$43,621
Immigrants | South Eastern Asia
46.6
/100
|
#176
Average
$43,539
Tlingit-Haida
45.9
/100
|
#177
Average
$43,516
Immigrants | Costa Rica
44.5
/100
|
#178
Average
$43,464
Finns
44.4
/100
|
#179
Average
$43,461
Sierra Leoneans
42.9
/100
|
#180
Average
$43,405
Welsh
38.2
/100
|
#181
Fair
$43,233
Immigrants | Vietnam
38.1
/100
|
#182
Fair
$43,229
Germans
33.9
/100
|
#183
Fair
$43,067
Spaniards
32.9
/100
|
#184
Fair
$43,028
Immigrants | Immigrants
32.5
/100
|
#185
Fair
$43,010
French Canadians
32.3
/100
|
#186
Fair
$43,003
Immigrants | Colombia
31.5
/100
|
#187
Fair
$42,971
Immigrants | Africa
31.0
/100
|
#188
Fair
$42,950