Latvian vs Immigrants from Mexico Householder Income Over 65 years
COMPARE
Latvian
Immigrants from Mexico
Householder Income Over 65 years
Householder Income Over 65 years Comparison
Latvians
Immigrants from Mexico
$67,326
HOUSEHOLDER INCOME OVER 65 YEARS
99.9/ 100
METRIC RATING
43rd/ 347
METRIC RANK
$52,801
HOUSEHOLDER INCOME OVER 65 YEARS
0.0/ 100
METRIC RATING
308th/ 347
METRIC RANK
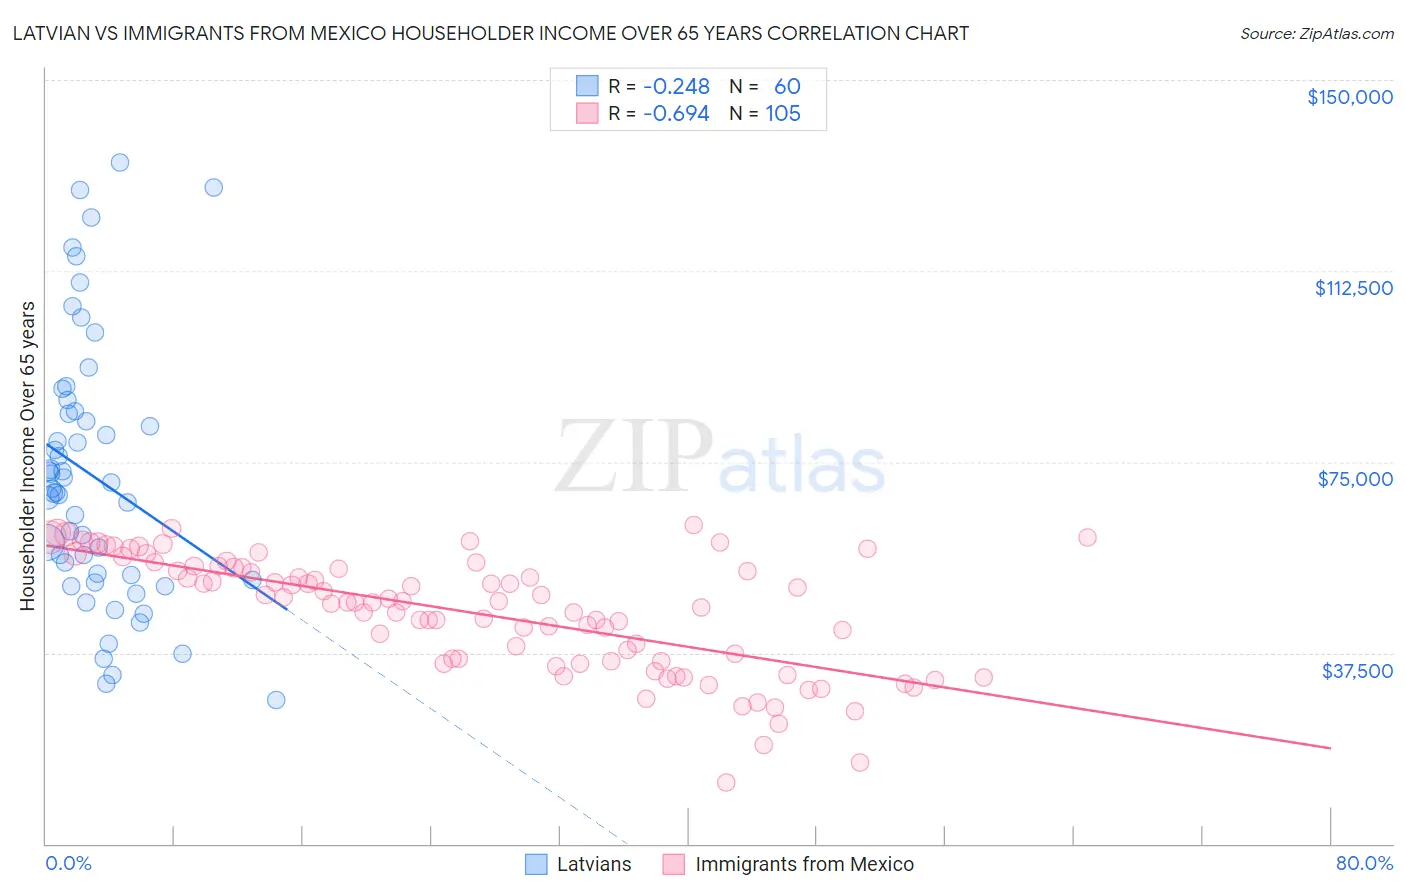
Latvian vs Immigrants from Mexico Householder Income Over 65 years Correlation Chart
The statistical analysis conducted on geographies consisting of 220,279,935 people shows a weak negative correlation between the proportion of Latvians and household income with householder over the age of 65 in the United States with a correlation coefficient (R) of -0.248 and weighted average of $67,326. Similarly, the statistical analysis conducted on geographies consisting of 510,126,392 people shows a significant negative correlation between the proportion of Immigrants from Mexico and household income with householder over the age of 65 in the United States with a correlation coefficient (R) of -0.694 and weighted average of $52,801, a difference of 27.5%.
Householder Income Over 65 years Correlation Summary
| Measurement | Latvian | Immigrants from Mexico |
| Minimum | $28,148 | $11,979 |
| Maximum | $133,874 | $62,508 |
| Range | $105,726 | $50,529 |
| Mean | $71,961 | $45,341 |
| Median | $69,364 | $47,467 |
| Interquartile 25% (IQ1) | $52,318 | $35,778 |
| Interquartile 75% (IQ3) | $84,761 | $54,433 |
| Interquartile Range (IQR) | $32,443 | $18,654 |
| Standard Deviation (Sample) | $25,745 | $11,387 |
| Standard Deviation (Population) | $25,529 | $11,333 |
Similar Demographics by Householder Income Over 65 years
Demographics Similar to Latvians by Householder Income Over 65 years
In terms of householder income over 65 years, the demographic groups most similar to Latvians are New Zealander ($67,333, a difference of 0.010%), Immigrants from South Africa ($67,234, a difference of 0.14%), Korean ($67,472, a difference of 0.22%), Immigrants from Asia ($67,594, a difference of 0.40%), and Russian ($67,626, a difference of 0.45%).
| Demographics | Rating | Rank | Householder Income Over 65 years |
| Immigrants | Austria | 99.9 /100 | #36 | Exceptional $68,208 |
| Turks | 99.9 /100 | #37 | Exceptional $68,037 |
| Estonians | 99.9 /100 | #38 | Exceptional $67,926 |
| Russians | 99.9 /100 | #39 | Exceptional $67,626 |
| Immigrants | Asia | 99.9 /100 | #40 | Exceptional $67,594 |
| Koreans | 99.9 /100 | #41 | Exceptional $67,472 |
| New Zealanders | 99.9 /100 | #42 | Exceptional $67,333 |
| Latvians | 99.9 /100 | #43 | Exceptional $67,326 |
| Immigrants | South Africa | 99.9 /100 | #44 | Exceptional $67,234 |
| Immigrants | Afghanistan | 99.8 /100 | #45 | Exceptional $67,007 |
| Cambodians | 99.8 /100 | #46 | Exceptional $66,892 |
| Australians | 99.8 /100 | #47 | Exceptional $66,891 |
| Immigrants | France | 99.8 /100 | #48 | Exceptional $66,826 |
| Immigrants | Indonesia | 99.8 /100 | #49 | Exceptional $66,694 |
| Immigrants | Turkey | 99.7 /100 | #50 | Exceptional $66,672 |
Demographics Similar to Immigrants from Mexico by Householder Income Over 65 years
In terms of householder income over 65 years, the demographic groups most similar to Immigrants from Mexico are Hispanic or Latino ($52,832, a difference of 0.060%), Pennsylvania German ($52,888, a difference of 0.17%), Pueblo ($52,930, a difference of 0.24%), Ute ($52,949, a difference of 0.28%), and Honduran ($52,634, a difference of 0.32%).
| Demographics | Rating | Rank | Householder Income Over 65 years |
| Yuman | 0.0 /100 | #301 | Tragic $53,110 |
| Spanish American Indians | 0.0 /100 | #302 | Tragic $53,077 |
| Choctaw | 0.0 /100 | #303 | Tragic $53,060 |
| Ute | 0.0 /100 | #304 | Tragic $52,949 |
| Pueblo | 0.0 /100 | #305 | Tragic $52,930 |
| Pennsylvania Germans | 0.0 /100 | #306 | Tragic $52,888 |
| Hispanics or Latinos | 0.0 /100 | #307 | Tragic $52,832 |
| Immigrants | Mexico | 0.0 /100 | #308 | Tragic $52,801 |
| Hondurans | 0.0 /100 | #309 | Tragic $52,634 |
| Sioux | 0.0 /100 | #310 | Tragic $52,509 |
| Seminole | 0.0 /100 | #311 | Tragic $52,373 |
| Immigrants | Azores | 0.0 /100 | #312 | Tragic $52,121 |
| Immigrants | Nicaragua | 0.0 /100 | #313 | Tragic $52,085 |
| Natives/Alaskans | 0.0 /100 | #314 | Tragic $52,081 |
| U.S. Virgin Islanders | 0.0 /100 | #315 | Tragic $52,072 |