Latvian vs Costa Rican Householder Income Over 65 years
COMPARE
Latvian
Costa Rican
Householder Income Over 65 years
Householder Income Over 65 years Comparison
Latvians
Costa Ricans
$67,326
HOUSEHOLDER INCOME OVER 65 YEARS
99.9/ 100
METRIC RATING
43rd/ 347
METRIC RANK
$61,638
HOUSEHOLDER INCOME OVER 65 YEARS
66.9/ 100
METRIC RATING
153rd/ 347
METRIC RANK
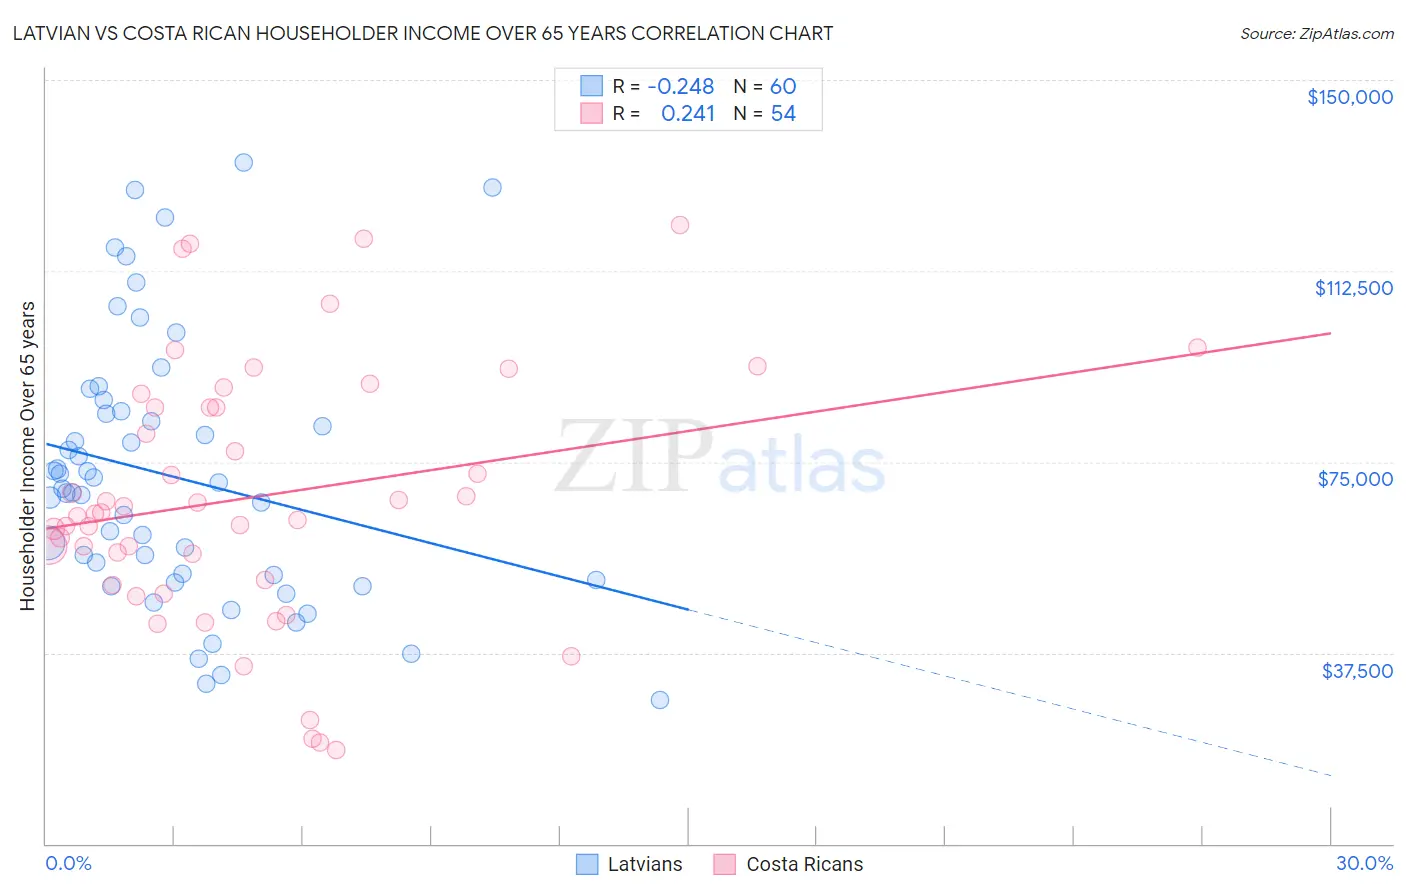
Latvian vs Costa Rican Householder Income Over 65 years Correlation Chart
The statistical analysis conducted on geographies consisting of 220,279,935 people shows a weak negative correlation between the proportion of Latvians and household income with householder over the age of 65 in the United States with a correlation coefficient (R) of -0.248 and weighted average of $67,326. Similarly, the statistical analysis conducted on geographies consisting of 253,120,412 people shows a weak positive correlation between the proportion of Costa Ricans and household income with householder over the age of 65 in the United States with a correlation coefficient (R) of 0.241 and weighted average of $61,638, a difference of 9.2%.
Householder Income Over 65 years Correlation Summary
| Measurement | Latvian | Costa Rican |
| Minimum | $28,148 | $18,343 |
| Maximum | $133,874 | $121,538 |
| Range | $105,726 | $103,195 |
| Mean | $71,961 | $68,075 |
| Median | $69,364 | $64,957 |
| Interquartile 25% (IQ1) | $52,318 | $51,771 |
| Interquartile 75% (IQ3) | $84,761 | $85,791 |
| Interquartile Range (IQR) | $32,443 | $34,020 |
| Standard Deviation (Sample) | $25,745 | $25,107 |
| Standard Deviation (Population) | $25,529 | $24,874 |
Similar Demographics by Householder Income Over 65 years
Demographics Similar to Latvians by Householder Income Over 65 years
In terms of householder income over 65 years, the demographic groups most similar to Latvians are New Zealander ($67,333, a difference of 0.010%), Immigrants from South Africa ($67,234, a difference of 0.14%), Korean ($67,472, a difference of 0.22%), Immigrants from Asia ($67,594, a difference of 0.40%), and Russian ($67,626, a difference of 0.45%).
| Demographics | Rating | Rank | Householder Income Over 65 years |
| Immigrants | Austria | 99.9 /100 | #36 | Exceptional $68,208 |
| Turks | 99.9 /100 | #37 | Exceptional $68,037 |
| Estonians | 99.9 /100 | #38 | Exceptional $67,926 |
| Russians | 99.9 /100 | #39 | Exceptional $67,626 |
| Immigrants | Asia | 99.9 /100 | #40 | Exceptional $67,594 |
| Koreans | 99.9 /100 | #41 | Exceptional $67,472 |
| New Zealanders | 99.9 /100 | #42 | Exceptional $67,333 |
| Latvians | 99.9 /100 | #43 | Exceptional $67,326 |
| Immigrants | South Africa | 99.9 /100 | #44 | Exceptional $67,234 |
| Immigrants | Afghanistan | 99.8 /100 | #45 | Exceptional $67,007 |
| Cambodians | 99.8 /100 | #46 | Exceptional $66,892 |
| Australians | 99.8 /100 | #47 | Exceptional $66,891 |
| Immigrants | France | 99.8 /100 | #48 | Exceptional $66,826 |
| Immigrants | Indonesia | 99.8 /100 | #49 | Exceptional $66,694 |
| Immigrants | Turkey | 99.7 /100 | #50 | Exceptional $66,672 |
Demographics Similar to Costa Ricans by Householder Income Over 65 years
In terms of householder income over 65 years, the demographic groups most similar to Costa Ricans are Armenian ($61,656, a difference of 0.030%), Swiss ($61,621, a difference of 0.030%), Hungarian ($61,673, a difference of 0.060%), Polish ($61,598, a difference of 0.060%), and Scandinavian ($61,586, a difference of 0.080%).
| Demographics | Rating | Rank | Householder Income Over 65 years |
| Immigrants | Southern Europe | 72.7 /100 | #146 | Good $61,902 |
| Immigrants | Nepal | 71.4 /100 | #147 | Good $61,843 |
| Alsatians | 70.5 /100 | #148 | Good $61,797 |
| Scottish | 69.1 /100 | #149 | Good $61,735 |
| Slavs | 68.5 /100 | #150 | Good $61,709 |
| Hungarians | 67.7 /100 | #151 | Good $61,673 |
| Armenians | 67.3 /100 | #152 | Good $61,656 |
| Costa Ricans | 66.9 /100 | #153 | Good $61,638 |
| Swiss | 66.5 /100 | #154 | Good $61,621 |
| Poles | 65.9 /100 | #155 | Good $61,598 |
| Scandinavians | 65.6 /100 | #156 | Good $61,586 |
| Macedonians | 65.1 /100 | #157 | Good $61,564 |
| English | 63.3 /100 | #158 | Good $61,487 |
| Brazilians | 62.7 /100 | #159 | Good $61,465 |
| Portuguese | 62.1 /100 | #160 | Good $61,440 |