Korean vs Immigrants from Belize Householder Income Ages 45 - 64 years
COMPARE
Korean
Immigrants from Belize
Householder Income Ages 45 - 64 years
Householder Income Ages 45 - 64 years Comparison
Koreans
Immigrants from Belize
$110,334
HOUSEHOLDER INCOME AGES 45 - 64 YEARS
99.3/ 100
METRIC RATING
70th/ 347
METRIC RANK
$87,229
HOUSEHOLDER INCOME AGES 45 - 64 YEARS
0.1/ 100
METRIC RATING
275th/ 347
METRIC RANK
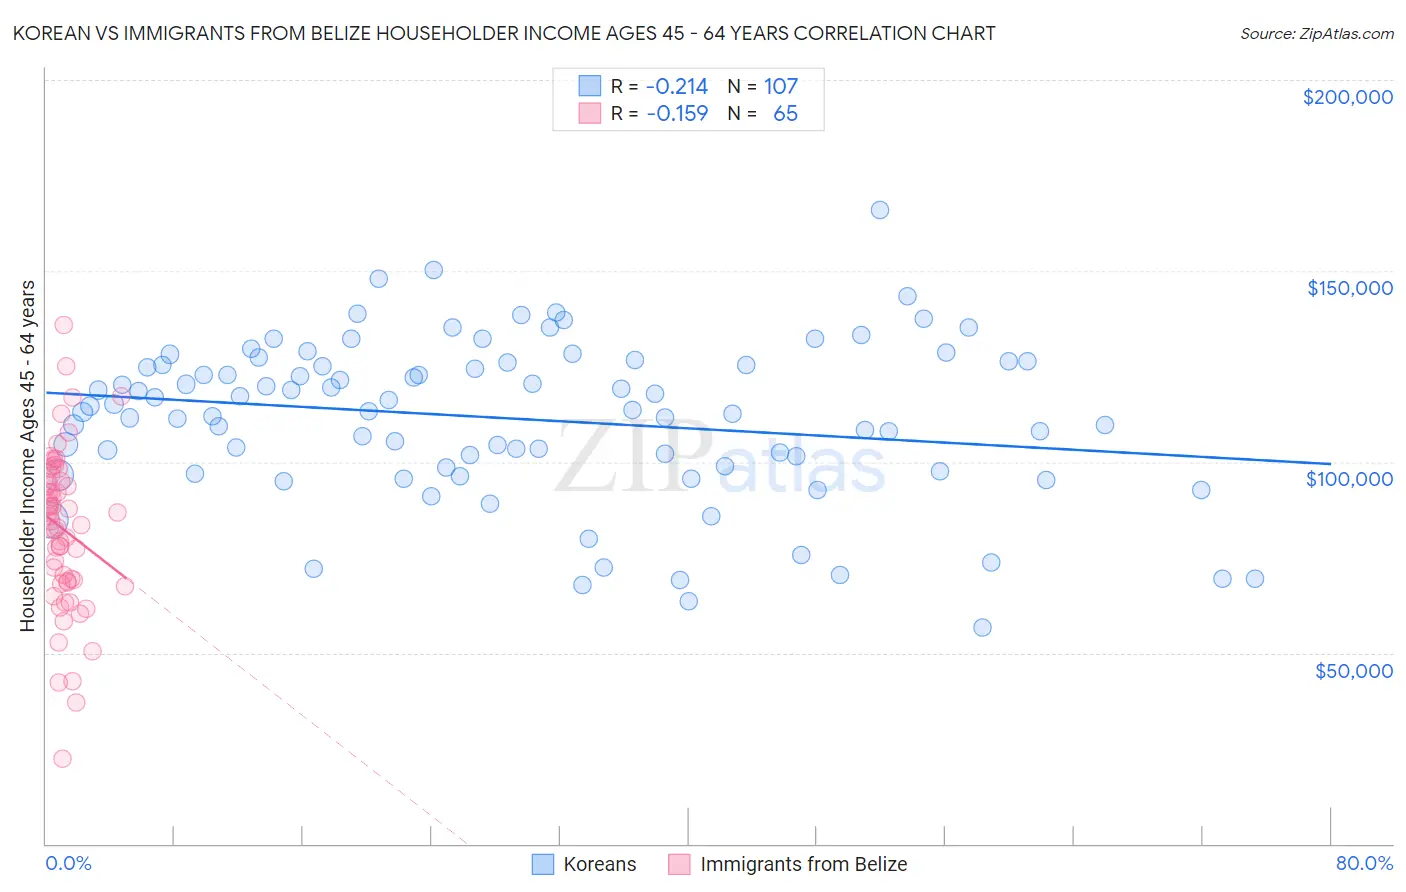
Korean vs Immigrants from Belize Householder Income Ages 45 - 64 years Correlation Chart
The statistical analysis conducted on geographies consisting of 509,189,713 people shows a weak negative correlation between the proportion of Koreans and household income with householder between the ages 45 and 64 in the United States with a correlation coefficient (R) of -0.214 and weighted average of $110,334. Similarly, the statistical analysis conducted on geographies consisting of 130,242,241 people shows a poor negative correlation between the proportion of Immigrants from Belize and household income with householder between the ages 45 and 64 in the United States with a correlation coefficient (R) of -0.159 and weighted average of $87,229, a difference of 26.5%.
Householder Income Ages 45 - 64 years Correlation Summary
| Measurement | Korean | Immigrants from Belize |
| Minimum | $56,563 | $22,213 |
| Maximum | $166,010 | $135,848 |
| Range | $109,447 | $113,635 |
| Mean | $111,314 | $82,353 |
| Median | $113,513 | $84,313 |
| Interquartile 25% (IQ1) | $98,457 | $68,610 |
| Interquartile 75% (IQ3) | $126,141 | $95,695 |
| Interquartile Range (IQR) | $27,684 | $27,084 |
| Standard Deviation (Sample) | $20,923 | $20,996 |
| Standard Deviation (Population) | $20,825 | $20,834 |
Similar Demographics by Householder Income Ages 45 - 64 years
Demographics Similar to Koreans by Householder Income Ages 45 - 64 years
In terms of householder income ages 45 - 64 years, the demographic groups most similar to Koreans are Immigrants from Italy ($110,434, a difference of 0.090%), Italian ($110,224, a difference of 0.10%), Assyrian/Chaldean/Syriac ($110,201, a difference of 0.12%), Argentinean ($110,103, a difference of 0.21%), and Immigrants from Romania ($110,633, a difference of 0.27%).
| Demographics | Rating | Rank | Householder Income Ages 45 - 64 years |
| Mongolians | 99.6 /100 | #63 | Exceptional $111,602 |
| Immigrants | Latvia | 99.6 /100 | #64 | Exceptional $111,454 |
| Immigrants | Belarus | 99.6 /100 | #65 | Exceptional $111,430 |
| New Zealanders | 99.6 /100 | #66 | Exceptional $111,286 |
| Laotians | 99.5 /100 | #67 | Exceptional $111,051 |
| Immigrants | Romania | 99.4 /100 | #68 | Exceptional $110,633 |
| Immigrants | Italy | 99.4 /100 | #69 | Exceptional $110,434 |
| Koreans | 99.3 /100 | #70 | Exceptional $110,334 |
| Italians | 99.3 /100 | #71 | Exceptional $110,224 |
| Assyrians/Chaldeans/Syriacs | 99.3 /100 | #72 | Exceptional $110,201 |
| Argentineans | 99.3 /100 | #73 | Exceptional $110,103 |
| Immigrants | Egypt | 99.2 /100 | #74 | Exceptional $109,941 |
| South Africans | 99.1 /100 | #75 | Exceptional $109,719 |
| Paraguayans | 99.0 /100 | #76 | Exceptional $109,447 |
| Immigrants | England | 99.0 /100 | #77 | Exceptional $109,446 |
Demographics Similar to Immigrants from Belize by Householder Income Ages 45 - 64 years
In terms of householder income ages 45 - 64 years, the demographic groups most similar to Immigrants from Belize are Immigrants from Latin America ($87,219, a difference of 0.010%), Iroquois ($87,255, a difference of 0.030%), Cree ($87,185, a difference of 0.050%), Immigrants from Jamaica ($87,035, a difference of 0.22%), and Yakama ($86,992, a difference of 0.27%).
| Demographics | Rating | Rank | Householder Income Ages 45 - 64 years |
| Immigrants | Micronesia | 0.2 /100 | #268 | Tragic $87,864 |
| Spanish Americans | 0.2 /100 | #269 | Tragic $87,836 |
| Immigrants | Liberia | 0.2 /100 | #270 | Tragic $87,739 |
| Guatemalans | 0.2 /100 | #271 | Tragic $87,705 |
| Cape Verdeans | 0.2 /100 | #272 | Tragic $87,580 |
| Spanish American Indians | 0.2 /100 | #273 | Tragic $87,561 |
| Iroquois | 0.1 /100 | #274 | Tragic $87,255 |
| Immigrants | Belize | 0.1 /100 | #275 | Tragic $87,229 |
| Immigrants | Latin America | 0.1 /100 | #276 | Tragic $87,219 |
| Cree | 0.1 /100 | #277 | Tragic $87,185 |
| Immigrants | Jamaica | 0.1 /100 | #278 | Tragic $87,035 |
| Yakama | 0.1 /100 | #279 | Tragic $86,992 |
| Immigrants | Somalia | 0.1 /100 | #280 | Tragic $86,987 |
| Yaqui | 0.1 /100 | #281 | Tragic $86,914 |
| Senegalese | 0.1 /100 | #282 | Tragic $86,897 |