Korean vs Immigrants from Barbados Householder Income Ages 45 - 64 years
COMPARE
Korean
Immigrants from Barbados
Householder Income Ages 45 - 64 years
Householder Income Ages 45 - 64 years Comparison
Koreans
Immigrants from Barbados
$110,334
HOUSEHOLDER INCOME AGES 45 - 64 YEARS
99.3/ 100
METRIC RATING
70th/ 347
METRIC RANK
$89,394
HOUSEHOLDER INCOME AGES 45 - 64 YEARS
0.4/ 100
METRIC RATING
258th/ 347
METRIC RANK
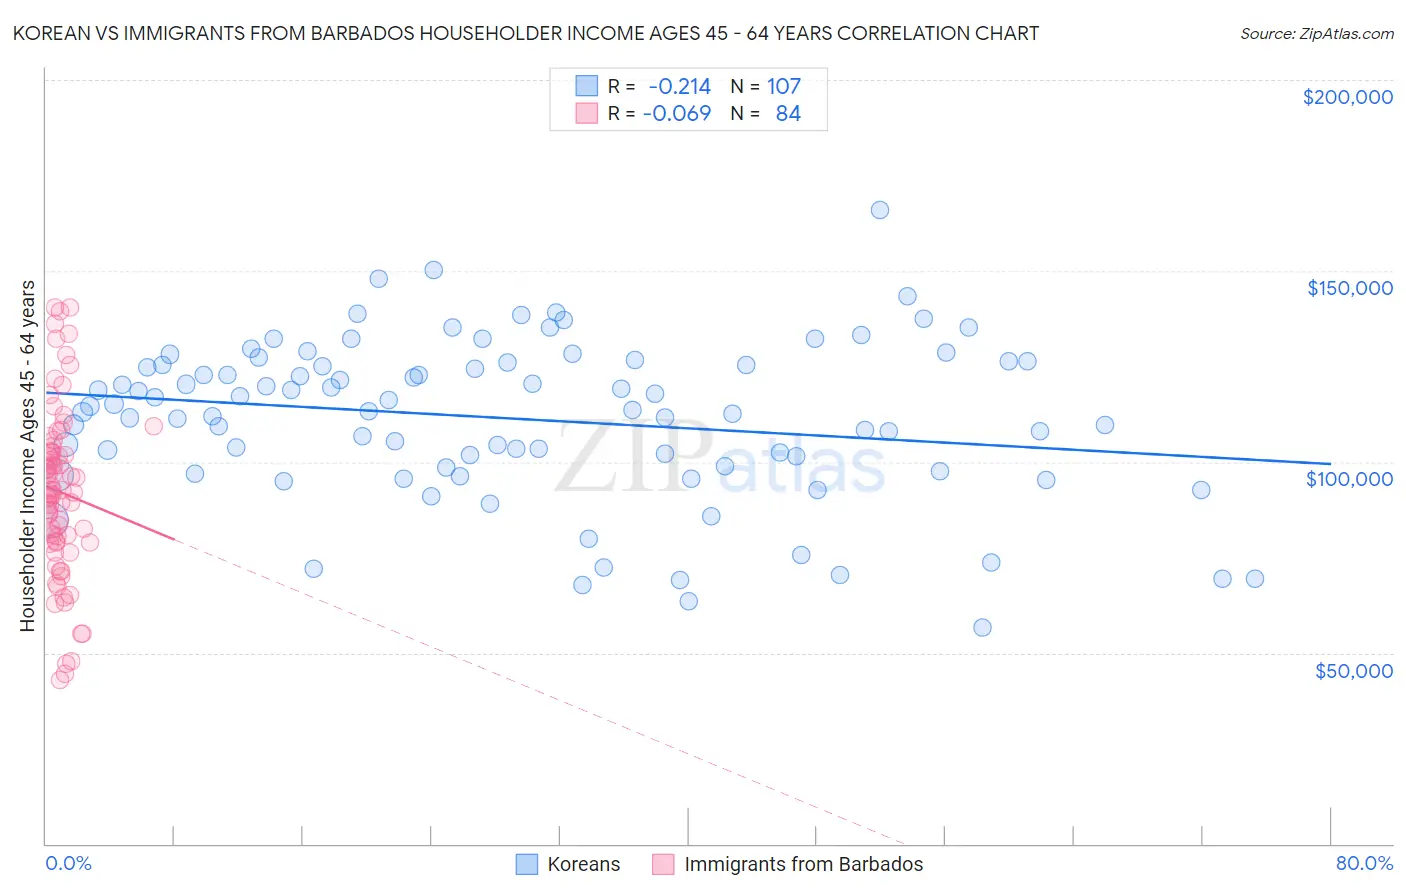
Korean vs Immigrants from Barbados Householder Income Ages 45 - 64 years Correlation Chart
The statistical analysis conducted on geographies consisting of 509,189,713 people shows a weak negative correlation between the proportion of Koreans and household income with householder between the ages 45 and 64 in the United States with a correlation coefficient (R) of -0.214 and weighted average of $110,334. Similarly, the statistical analysis conducted on geographies consisting of 112,734,331 people shows a slight negative correlation between the proportion of Immigrants from Barbados and household income with householder between the ages 45 and 64 in the United States with a correlation coefficient (R) of -0.069 and weighted average of $89,394, a difference of 23.4%.
Householder Income Ages 45 - 64 years Correlation Summary
| Measurement | Korean | Immigrants from Barbados |
| Minimum | $56,563 | $42,917 |
| Maximum | $166,010 | $140,429 |
| Range | $109,447 | $97,512 |
| Mean | $111,314 | $92,160 |
| Median | $113,513 | $92,269 |
| Interquartile 25% (IQ1) | $98,457 | $79,098 |
| Interquartile 75% (IQ3) | $126,141 | $102,596 |
| Interquartile Range (IQR) | $27,684 | $23,498 |
| Standard Deviation (Sample) | $20,923 | $21,991 |
| Standard Deviation (Population) | $20,825 | $21,860 |
Similar Demographics by Householder Income Ages 45 - 64 years
Demographics Similar to Koreans by Householder Income Ages 45 - 64 years
In terms of householder income ages 45 - 64 years, the demographic groups most similar to Koreans are Immigrants from Italy ($110,434, a difference of 0.090%), Italian ($110,224, a difference of 0.10%), Assyrian/Chaldean/Syriac ($110,201, a difference of 0.12%), Argentinean ($110,103, a difference of 0.21%), and Immigrants from Romania ($110,633, a difference of 0.27%).
| Demographics | Rating | Rank | Householder Income Ages 45 - 64 years |
| Mongolians | 99.6 /100 | #63 | Exceptional $111,602 |
| Immigrants | Latvia | 99.6 /100 | #64 | Exceptional $111,454 |
| Immigrants | Belarus | 99.6 /100 | #65 | Exceptional $111,430 |
| New Zealanders | 99.6 /100 | #66 | Exceptional $111,286 |
| Laotians | 99.5 /100 | #67 | Exceptional $111,051 |
| Immigrants | Romania | 99.4 /100 | #68 | Exceptional $110,633 |
| Immigrants | Italy | 99.4 /100 | #69 | Exceptional $110,434 |
| Koreans | 99.3 /100 | #70 | Exceptional $110,334 |
| Italians | 99.3 /100 | #71 | Exceptional $110,224 |
| Assyrians/Chaldeans/Syriacs | 99.3 /100 | #72 | Exceptional $110,201 |
| Argentineans | 99.3 /100 | #73 | Exceptional $110,103 |
| Immigrants | Egypt | 99.2 /100 | #74 | Exceptional $109,941 |
| South Africans | 99.1 /100 | #75 | Exceptional $109,719 |
| Paraguayans | 99.0 /100 | #76 | Exceptional $109,447 |
| Immigrants | England | 99.0 /100 | #77 | Exceptional $109,446 |
Demographics Similar to Immigrants from Barbados by Householder Income Ages 45 - 64 years
In terms of householder income ages 45 - 64 years, the demographic groups most similar to Immigrants from Barbados are German Russian ($89,398, a difference of 0.0%), Immigrants from Nicaragua ($89,108, a difference of 0.32%), French American Indian ($89,811, a difference of 0.47%), Liberian ($88,929, a difference of 0.52%), and West Indian ($89,906, a difference of 0.57%).
| Demographics | Rating | Rank | Householder Income Ages 45 - 64 years |
| Americans | 0.7 /100 | #251 | Tragic $90,536 |
| Marshallese | 0.7 /100 | #252 | Tragic $90,455 |
| Barbadians | 0.6 /100 | #253 | Tragic $90,266 |
| Immigrants | Guyana | 0.6 /100 | #254 | Tragic $90,186 |
| West Indians | 0.5 /100 | #255 | Tragic $89,906 |
| French American Indians | 0.5 /100 | #256 | Tragic $89,811 |
| German Russians | 0.4 /100 | #257 | Tragic $89,398 |
| Immigrants | Barbados | 0.4 /100 | #258 | Tragic $89,394 |
| Immigrants | Nicaragua | 0.4 /100 | #259 | Tragic $89,108 |
| Liberians | 0.3 /100 | #260 | Tragic $88,929 |
| Belizeans | 0.3 /100 | #261 | Tragic $88,684 |
| Somalis | 0.3 /100 | #262 | Tragic $88,600 |
| Immigrants | Senegal | 0.3 /100 | #263 | Tragic $88,421 |
| Osage | 0.3 /100 | #264 | Tragic $88,390 |
| Jamaicans | 0.2 /100 | #265 | Tragic $88,327 |