Korean vs Ugandan Householder Income Ages 45 - 64 years
COMPARE
Korean
Ugandan
Householder Income Ages 45 - 64 years
Householder Income Ages 45 - 64 years Comparison
Koreans
Ugandans
$110,334
HOUSEHOLDER INCOME AGES 45 - 64 YEARS
99.3/ 100
METRIC RATING
70th/ 347
METRIC RANK
$103,472
HOUSEHOLDER INCOME AGES 45 - 64 YEARS
82.9/ 100
METRIC RATING
145th/ 347
METRIC RANK
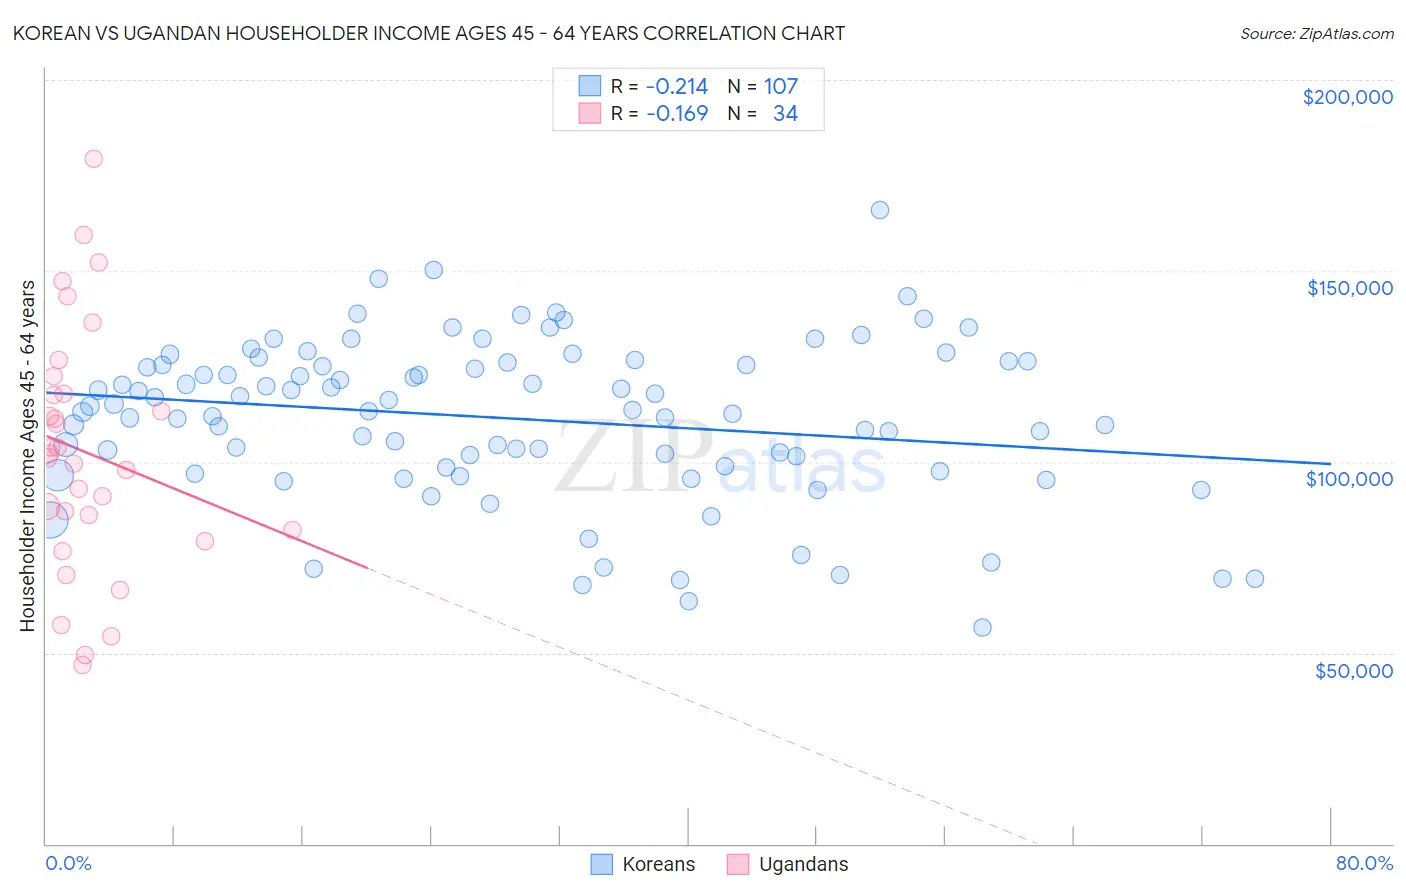
Korean vs Ugandan Householder Income Ages 45 - 64 years Correlation Chart
The statistical analysis conducted on geographies consisting of 509,189,713 people shows a weak negative correlation between the proportion of Koreans and household income with householder between the ages 45 and 64 in the United States with a correlation coefficient (R) of -0.214 and weighted average of $110,334. Similarly, the statistical analysis conducted on geographies consisting of 93,977,582 people shows a poor negative correlation between the proportion of Ugandans and household income with householder between the ages 45 and 64 in the United States with a correlation coefficient (R) of -0.169 and weighted average of $103,472, a difference of 6.6%.
Householder Income Ages 45 - 64 years Correlation Summary
| Measurement | Korean | Ugandan |
| Minimum | $56,563 | $46,767 |
| Maximum | $166,010 | $179,310 |
| Range | $109,447 | $132,543 |
| Mean | $111,314 | $102,498 |
| Median | $113,513 | $101,686 |
| Interquartile 25% (IQ1) | $98,457 | $82,188 |
| Interquartile 75% (IQ3) | $126,141 | $117,857 |
| Interquartile Range (IQR) | $27,684 | $35,669 |
| Standard Deviation (Sample) | $20,923 | $31,832 |
| Standard Deviation (Population) | $20,825 | $31,360 |
Similar Demographics by Householder Income Ages 45 - 64 years
Demographics Similar to Koreans by Householder Income Ages 45 - 64 years
In terms of householder income ages 45 - 64 years, the demographic groups most similar to Koreans are Immigrants from Italy ($110,434, a difference of 0.090%), Italian ($110,224, a difference of 0.10%), Assyrian/Chaldean/Syriac ($110,201, a difference of 0.12%), Argentinean ($110,103, a difference of 0.21%), and Immigrants from Romania ($110,633, a difference of 0.27%).
| Demographics | Rating | Rank | Householder Income Ages 45 - 64 years |
| Mongolians | 99.6 /100 | #63 | Exceptional $111,602 |
| Immigrants | Latvia | 99.6 /100 | #64 | Exceptional $111,454 |
| Immigrants | Belarus | 99.6 /100 | #65 | Exceptional $111,430 |
| New Zealanders | 99.6 /100 | #66 | Exceptional $111,286 |
| Laotians | 99.5 /100 | #67 | Exceptional $111,051 |
| Immigrants | Romania | 99.4 /100 | #68 | Exceptional $110,633 |
| Immigrants | Italy | 99.4 /100 | #69 | Exceptional $110,434 |
| Koreans | 99.3 /100 | #70 | Exceptional $110,334 |
| Italians | 99.3 /100 | #71 | Exceptional $110,224 |
| Assyrians/Chaldeans/Syriacs | 99.3 /100 | #72 | Exceptional $110,201 |
| Argentineans | 99.3 /100 | #73 | Exceptional $110,103 |
| Immigrants | Egypt | 99.2 /100 | #74 | Exceptional $109,941 |
| South Africans | 99.1 /100 | #75 | Exceptional $109,719 |
| Paraguayans | 99.0 /100 | #76 | Exceptional $109,447 |
| Immigrants | England | 99.0 /100 | #77 | Exceptional $109,446 |
Demographics Similar to Ugandans by Householder Income Ages 45 - 64 years
In terms of householder income ages 45 - 64 years, the demographic groups most similar to Ugandans are Czech ($103,507, a difference of 0.030%), Serbian ($103,522, a difference of 0.050%), Luxembourger ($103,536, a difference of 0.060%), Immigrants from Chile ($103,412, a difference of 0.060%), and Basque ($103,387, a difference of 0.080%).
| Demographics | Rating | Rank | Householder Income Ages 45 - 64 years |
| Ethiopians | 84.7 /100 | #138 | Excellent $103,736 |
| Immigrants | Oceania | 84.5 /100 | #139 | Excellent $103,705 |
| Norwegians | 84.3 /100 | #140 | Excellent $103,682 |
| Immigrants | Uganda | 83.7 /100 | #141 | Excellent $103,584 |
| Luxembourgers | 83.3 /100 | #142 | Excellent $103,536 |
| Serbians | 83.2 /100 | #143 | Excellent $103,522 |
| Czechs | 83.1 /100 | #144 | Excellent $103,507 |
| Ugandans | 82.9 /100 | #145 | Excellent $103,472 |
| Immigrants | Chile | 82.5 /100 | #146 | Excellent $103,412 |
| Basques | 82.3 /100 | #147 | Excellent $103,387 |
| Immigrants | Germany | 81.5 /100 | #148 | Excellent $103,282 |
| Immigrants | Sierra Leone | 81.1 /100 | #149 | Excellent $103,227 |
| Immigrants | Peru | 80.7 /100 | #150 | Excellent $103,173 |
| Swiss | 79.9 /100 | #151 | Good $103,071 |
| Irish | 79.8 /100 | #152 | Good $103,067 |