Tohono O'odham vs Immigrants from Nepal Householder Income Ages 45 - 64 years
COMPARE
Tohono O'odham
Immigrants from Nepal
Householder Income Ages 45 - 64 years
Householder Income Ages 45 - 64 years Comparison
Tohono O'odham
Immigrants from Nepal
$73,774
HOUSEHOLDER INCOME AGES 45 - 64 YEARS
0.0/ 100
METRIC RATING
342nd/ 347
METRIC RANK
$102,190
HOUSEHOLDER INCOME AGES 45 - 64 YEARS
71.8/ 100
METRIC RATING
161st/ 347
METRIC RANK
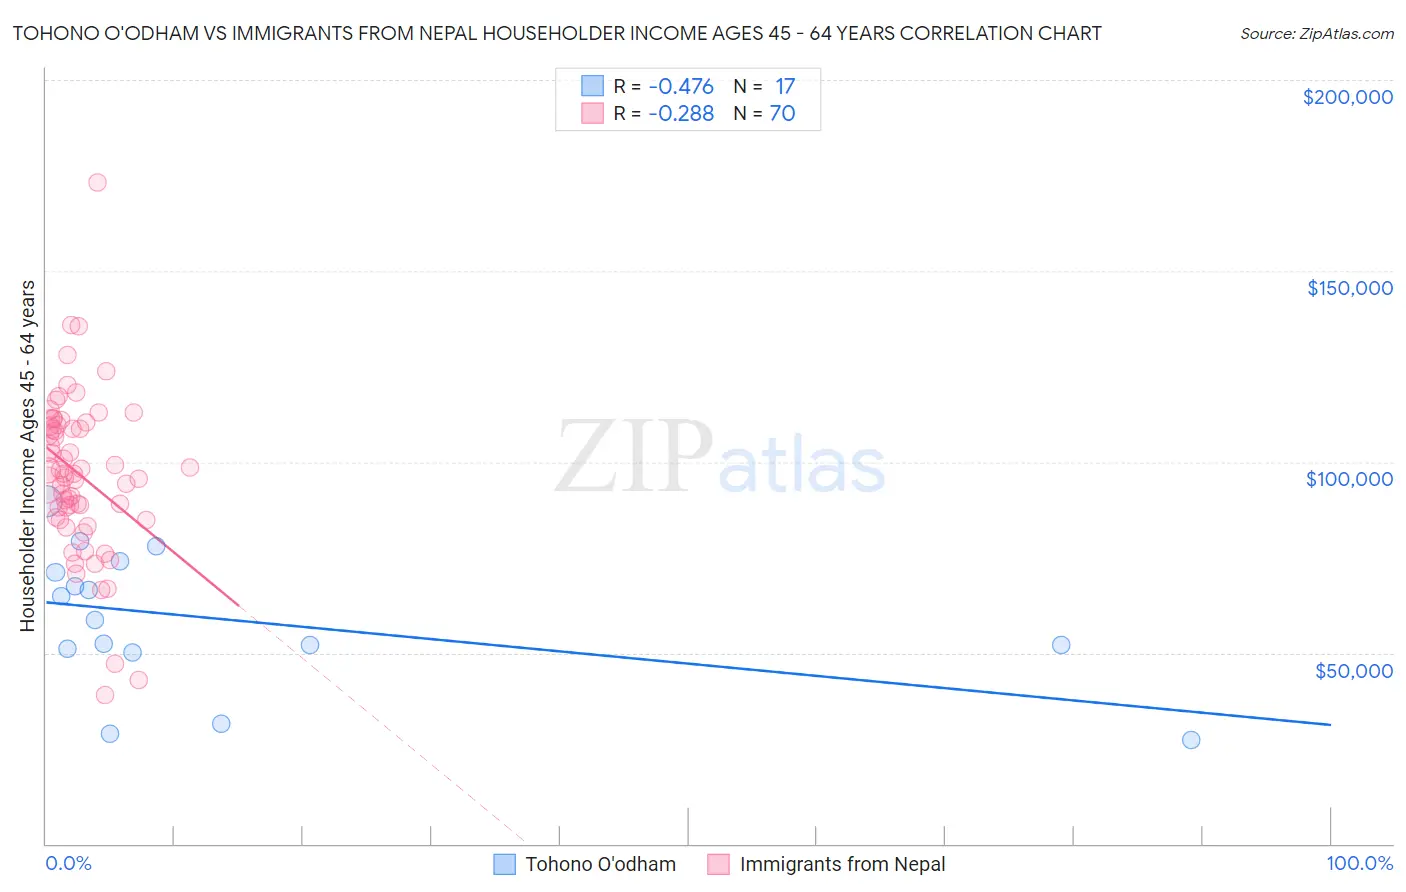
Tohono O'odham vs Immigrants from Nepal Householder Income Ages 45 - 64 years Correlation Chart
The statistical analysis conducted on geographies consisting of 58,700,598 people shows a moderate negative correlation between the proportion of Tohono O'odham and household income with householder between the ages 45 and 64 in the United States with a correlation coefficient (R) of -0.476 and weighted average of $73,774. Similarly, the statistical analysis conducted on geographies consisting of 186,605,051 people shows a weak negative correlation between the proportion of Immigrants from Nepal and household income with householder between the ages 45 and 64 in the United States with a correlation coefficient (R) of -0.288 and weighted average of $102,190, a difference of 38.5%.
Householder Income Ages 45 - 64 years Correlation Summary
| Measurement | Tohono O'odham | Immigrants from Nepal |
| Minimum | $27,250 | $38,929 |
| Maximum | $89,534 | $173,233 |
| Range | $62,284 | $134,304 |
| Mean | $58,522 | $96,757 |
| Median | $58,558 | $96,927 |
| Interquartile 25% (IQ1) | $50,712 | $85,480 |
| Interquartile 75% (IQ3) | $72,531 | $109,661 |
| Interquartile Range (IQR) | $21,819 | $24,181 |
| Standard Deviation (Sample) | $18,007 | $21,222 |
| Standard Deviation (Population) | $17,469 | $21,070 |
Similar Demographics by Householder Income Ages 45 - 64 years
Demographics Similar to Tohono O'odham by Householder Income Ages 45 - 64 years
In terms of householder income ages 45 - 64 years, the demographic groups most similar to Tohono O'odham are Pima ($73,365, a difference of 0.56%), Crow ($74,257, a difference of 0.65%), Immigrants from Yemen ($74,575, a difference of 1.1%), Kiowa ($74,815, a difference of 1.4%), and Houma ($72,093, a difference of 2.3%).
| Demographics | Rating | Rank | Householder Income Ages 45 - 64 years |
| Immigrants | Congo | 0.0 /100 | #333 | Tragic $77,850 |
| Menominee | 0.0 /100 | #334 | Tragic $76,903 |
| Cheyenne | 0.0 /100 | #335 | Tragic $76,362 |
| Arapaho | 0.0 /100 | #336 | Tragic $75,945 |
| Pueblo | 0.0 /100 | #337 | Tragic $75,601 |
| Hopi | 0.0 /100 | #338 | Tragic $75,562 |
| Kiowa | 0.0 /100 | #339 | Tragic $74,815 |
| Immigrants | Yemen | 0.0 /100 | #340 | Tragic $74,575 |
| Crow | 0.0 /100 | #341 | Tragic $74,257 |
| Tohono O'odham | 0.0 /100 | #342 | Tragic $73,774 |
| Pima | 0.0 /100 | #343 | Tragic $73,365 |
| Houma | 0.0 /100 | #344 | Tragic $72,093 |
| Navajo | 0.0 /100 | #345 | Tragic $69,759 |
| Puerto Ricans | 0.0 /100 | #346 | Tragic $69,234 |
| Lumbee | 0.0 /100 | #347 | Tragic $65,113 |
Demographics Similar to Immigrants from Nepal by Householder Income Ages 45 - 64 years
In terms of householder income ages 45 - 64 years, the demographic groups most similar to Immigrants from Nepal are Icelander ($102,261, a difference of 0.070%), Scottish ($102,123, a difference of 0.070%), English ($102,021, a difference of 0.17%), Immigrants from Morocco ($102,015, a difference of 0.17%), and Sierra Leonean ($102,427, a difference of 0.23%).
| Demographics | Rating | Rank | Householder Income Ages 45 - 64 years |
| Slovenes | 78.3 /100 | #154 | Good $102,885 |
| Costa Ricans | 77.4 /100 | #155 | Good $102,779 |
| Carpatho Rusyns | 77.4 /100 | #156 | Good $102,777 |
| Immigrants | Ethiopia | 77.3 /100 | #157 | Good $102,763 |
| Slavs | 76.1 /100 | #158 | Good $102,629 |
| Sierra Leoneans | 74.2 /100 | #159 | Good $102,427 |
| Icelanders | 72.5 /100 | #160 | Good $102,261 |
| Immigrants | Nepal | 71.8 /100 | #161 | Good $102,190 |
| Scottish | 71.1 /100 | #162 | Good $102,123 |
| English | 70.1 /100 | #163 | Good $102,021 |
| Immigrants | Morocco | 70.0 /100 | #164 | Good $102,015 |
| Immigrants | Albania | 69.4 /100 | #165 | Good $101,957 |
| Samoans | 65.3 /100 | #166 | Good $101,580 |
| Czechoslovakians | 63.0 /100 | #167 | Good $101,387 |
| South American Indians | 60.5 /100 | #168 | Good $101,171 |