Korean vs White/Caucasian Householder Income Ages 45 - 64 years
COMPARE
Korean
White/Caucasian
Householder Income Ages 45 - 64 years
Householder Income Ages 45 - 64 years Comparison
Koreans
Whites/Caucasians
$110,334
HOUSEHOLDER INCOME AGES 45 - 64 YEARS
99.3/ 100
METRIC RATING
70th/ 347
METRIC RANK
$98,091
HOUSEHOLDER INCOME AGES 45 - 64 YEARS
24.6/ 100
METRIC RATING
199th/ 347
METRIC RANK
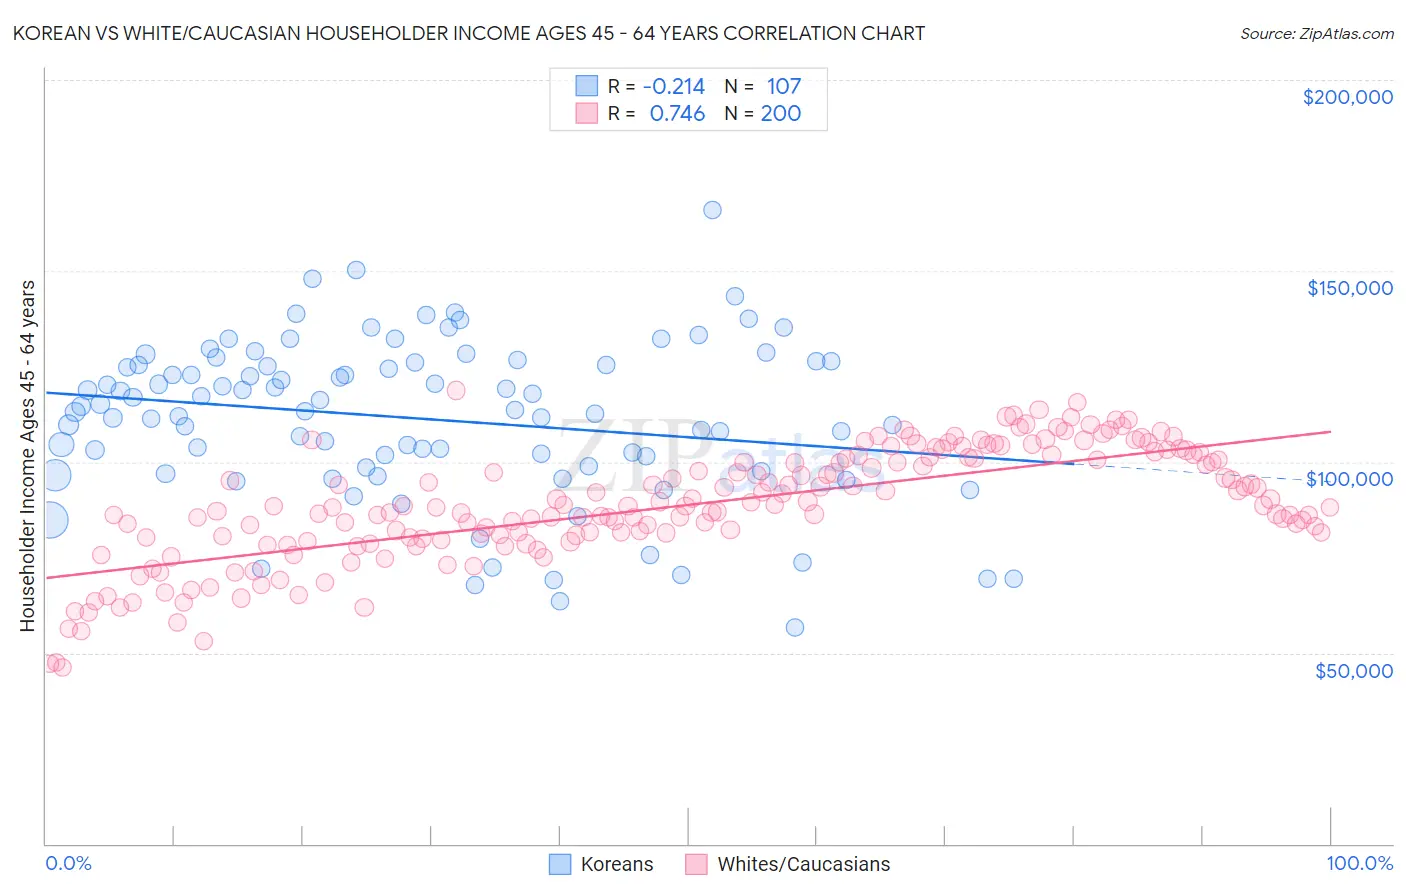
Korean vs White/Caucasian Householder Income Ages 45 - 64 years Correlation Chart
The statistical analysis conducted on geographies consisting of 509,189,713 people shows a weak negative correlation between the proportion of Koreans and household income with householder between the ages 45 and 64 in the United States with a correlation coefficient (R) of -0.214 and weighted average of $110,334. Similarly, the statistical analysis conducted on geographies consisting of 579,240,232 people shows a strong positive correlation between the proportion of Whites/Caucasians and household income with householder between the ages 45 and 64 in the United States with a correlation coefficient (R) of 0.746 and weighted average of $98,091, a difference of 12.5%.
Householder Income Ages 45 - 64 years Correlation Summary
| Measurement | Korean | White/Caucasian |
| Minimum | $56,563 | $46,068 |
| Maximum | $166,010 | $118,717 |
| Range | $109,447 | $72,649 |
| Mean | $111,314 | $88,743 |
| Median | $113,513 | $88,408 |
| Interquartile 25% (IQ1) | $98,457 | $80,288 |
| Interquartile 75% (IQ3) | $126,141 | $101,075 |
| Interquartile Range (IQR) | $27,684 | $20,787 |
| Standard Deviation (Sample) | $20,923 | $14,868 |
| Standard Deviation (Population) | $20,825 | $14,830 |
Similar Demographics by Householder Income Ages 45 - 64 years
Demographics Similar to Koreans by Householder Income Ages 45 - 64 years
In terms of householder income ages 45 - 64 years, the demographic groups most similar to Koreans are Immigrants from Italy ($110,434, a difference of 0.090%), Italian ($110,224, a difference of 0.10%), Assyrian/Chaldean/Syriac ($110,201, a difference of 0.12%), Argentinean ($110,103, a difference of 0.21%), and Immigrants from Romania ($110,633, a difference of 0.27%).
| Demographics | Rating | Rank | Householder Income Ages 45 - 64 years |
| Mongolians | 99.6 /100 | #63 | Exceptional $111,602 |
| Immigrants | Latvia | 99.6 /100 | #64 | Exceptional $111,454 |
| Immigrants | Belarus | 99.6 /100 | #65 | Exceptional $111,430 |
| New Zealanders | 99.6 /100 | #66 | Exceptional $111,286 |
| Laotians | 99.5 /100 | #67 | Exceptional $111,051 |
| Immigrants | Romania | 99.4 /100 | #68 | Exceptional $110,633 |
| Immigrants | Italy | 99.4 /100 | #69 | Exceptional $110,434 |
| Koreans | 99.3 /100 | #70 | Exceptional $110,334 |
| Italians | 99.3 /100 | #71 | Exceptional $110,224 |
| Assyrians/Chaldeans/Syriacs | 99.3 /100 | #72 | Exceptional $110,201 |
| Argentineans | 99.3 /100 | #73 | Exceptional $110,103 |
| Immigrants | Egypt | 99.2 /100 | #74 | Exceptional $109,941 |
| South Africans | 99.1 /100 | #75 | Exceptional $109,719 |
| Paraguayans | 99.0 /100 | #76 | Exceptional $109,447 |
| Immigrants | England | 99.0 /100 | #77 | Exceptional $109,446 |
Demographics Similar to Whites/Caucasians by Householder Income Ages 45 - 64 years
In terms of householder income ages 45 - 64 years, the demographic groups most similar to Whites/Caucasians are Immigrants from Iraq ($98,201, a difference of 0.11%), Immigrants from Kenya ($97,964, a difference of 0.13%), Puget Sound Salish ($98,340, a difference of 0.25%), Immigrants from Eastern Africa ($98,467, a difference of 0.38%), and Spanish ($98,554, a difference of 0.47%).
| Demographics | Rating | Rank | Householder Income Ages 45 - 64 years |
| Celtics | 32.9 /100 | #192 | Fair $98,896 |
| Hawaiians | 31.6 /100 | #193 | Fair $98,778 |
| Uruguayans | 30.3 /100 | #194 | Fair $98,660 |
| Spanish | 29.2 /100 | #195 | Fair $98,554 |
| Immigrants | Eastern Africa | 28.3 /100 | #196 | Fair $98,467 |
| Puget Sound Salish | 27.0 /100 | #197 | Fair $98,340 |
| Immigrants | Iraq | 25.7 /100 | #198 | Fair $98,201 |
| Whites/Caucasians | 24.6 /100 | #199 | Fair $98,091 |
| Immigrants | Kenya | 23.5 /100 | #200 | Fair $97,964 |
| Yugoslavians | 20.0 /100 | #201 | Fair $97,558 |
| Tlingit-Haida | 18.9 /100 | #202 | Poor $97,417 |
| Immigrants | Thailand | 18.8 /100 | #203 | Poor $97,400 |
| Immigrants | Eritrea | 18.6 /100 | #204 | Poor $97,373 |
| Immigrants | Colombia | 18.0 /100 | #205 | Poor $97,290 |
| Immigrants | Africa | 17.9 /100 | #206 | Poor $97,284 |