Immigrants from Western Asia vs Immigrants from Nepal Householder Income Ages 45 - 64 years

COMPARE

Immigrants from Western Asia
Race
Ancestry
AfghanAfricanAlaska NativeAlaskan AthabascanAlbanianAleutAlsatianAmericanApacheArabArapahoArgentineanArmenianAssyrian/Chaldean/SyriacAustralianAustrianBahamianBangladeshiBarbadianBasqueBelgianBelizeanBermudanBhutaneseBlackfeetBolivianBrazilianBritishBritish West IndianBulgarianBurmeseCajunCambodianCanadianCape VerdeanCarpatho RusynCelticCentral AmericanCentral American IndianCherokeeCheyenneChickasawChileanChineseChippewaChoctawColombianColvilleComancheCosta RicanCreeCreekCroatianCrowCubanCypriotCzechCzechoslovakianDanishDelawareDominicanDutchDutch West IndianEastern EuropeanEcuadorianEgyptianEnglishEstonianEthiopianEuropeanFijianFilipinoFinnishFrenchFrench American IndianFrench CanadianGermanGerman RussianGhanaianGreekGuamanian/ChamorroGuatemalanGuyaneseHaitianHmongHonduranHopiHoumaHungarianIcelanderIndian (Asian)IndonesianInupiatIranianIraqiIrishIroquoisIsraeliItalianJamaicanJapaneseJordanianKenyanKiowaKoreanLaotianLatvianLebaneseLiberianLithuanianLumbeeLuxembourgerMacedonianMalaysianMalteseMarshalleseMenomineeMexicanMexican American IndianMongolianMoroccanNative HawaiianNavajoNepaleseNew ZealanderNicaraguanNigerianNorthern EuropeanNorwegianOkinawanOsageOttawaPaiutePakistaniPalestinianPanamanianParaguayanPennsylvania GermanPeruvianPimaPolishPortuguesePotawatomiPuebloPuerto RicanPuget Sound SalishRomanianRussianSalvadoranSamoanScandinavianScotch-IrishScottishSeminoleSenegaleseSerbianShoshoneSierra LeoneanSiouxSlavicSlovakSloveneSomaliSouth AfricanSouth AmericanSouth American IndianSoviet UnionSpaniardSpanishSpanish AmericanSpanish American IndianSri LankanSubsaharan AfricanSudaneseSwedishSwissSyrianTaiwaneseThaiTlingit-HaidaTohono O'OdhamTonganTrinidadian and TobagonianTsimshianTurkishU.S. Virgin IslanderUgandanUkrainianUruguayanUteVenezuelanVietnameseWelshWest IndianYakamaYaquiYugoslavianYumanYup'ikZimbabwean
Immigration
NonimmigrantsImmigrantsAfghanistanAfricaAlbaniaArgentinaArmeniaAsiaAustraliaAustriaBahamasBangladeshBarbadosBelarusBelgiumBelizeBoliviaBosnia and HerzegovinaBrazilBulgariaBurma/MyanmarCabo VerdeCambodiaCameroonCanadaCaribbeanCentral AmericaChileChinaColombiaCongoCosta RicaCroatiaCubaCzechoslovakiaDenmarkDominicaDominican RepublicEastern AfricaEastern AsiaEastern EuropeEcuadorEgyptEl SalvadorEnglandEritreaEthiopiaEuropeFijiFranceGermanyGhanaGreeceGrenadaGuatemalaGuyanaHaitiHondurasHong KongHungaryIndiaIndonesiaIranIraqIrelandIsraelItalyJamaicaJapanJordanKazakhstanKenyaKoreaKuwaitLaosLatin AmericaLatviaLebanonLiberiaLithuaniaMalaysiaMexicoMicronesiaMiddle AfricaMoldovaMoroccoNetherlandsNicaraguaNigeriaNorth AmericaNorth MacedoniaNorthern AfricaNorthern EuropeNorwayOceaniaPakistanPanamaPeruPhilippinesPolandPortugalRomaniaRussiaSaudi ArabiaScotlandSenegalSerbiaSierra LeoneSingaporeSomaliaSouth AfricaSouth AmericaSouth Central AsiaSouth Eastern AsiaSouthern EuropeSpainSri LankaSt. Vincent and the GrenadinesSudanSwedenSwitzerlandSyriaTaiwanThailandTrinidad and TobagoTurkeyUgandaUkraineUruguayUzbekistanVenezuelaVietnamWest IndiesWestern AfricaWestern AsiaWestern EuropeYemenZaireZimbabweAzores
Immigrants from Nepal
Race
Ancestry
AfghanAfricanAlaska NativeAlaskan AthabascanAlbanianAleutAlsatianAmericanApacheArabArapahoArgentineanArmenianAssyrian/Chaldean/SyriacAustralianAustrianBahamianBangladeshiBarbadianBasqueBelgianBelizeanBermudanBhutaneseBlackfeetBolivianBrazilianBritishBritish West IndianBulgarianBurmeseCajunCambodianCanadianCape VerdeanCarpatho RusynCelticCentral AmericanCentral American IndianCherokeeCheyenneChickasawChileanChineseChippewaChoctawColombianColvilleComancheCosta RicanCreeCreekCroatianCrowCubanCypriotCzechCzechoslovakianDanishDelawareDominicanDutchDutch West IndianEastern EuropeanEcuadorianEgyptianEnglishEstonianEthiopianEuropeanFijianFilipinoFinnishFrenchFrench American IndianFrench CanadianGermanGerman RussianGhanaianGreekGuamanian/ChamorroGuatemalanGuyaneseHaitianHmongHonduranHopiHoumaHungarianIcelanderIndian (Asian)IndonesianInupiatIranianIraqiIrishIroquoisIsraeliItalianJamaicanJapaneseJordanianKenyanKiowaKoreanLaotianLatvianLebaneseLiberianLithuanianLumbeeLuxembourgerMacedonianMalaysianMalteseMarshalleseMenomineeMexicanMexican American IndianMongolianMoroccanNative HawaiianNavajoNepaleseNew ZealanderNicaraguanNigerianNorthern EuropeanNorwegianOkinawanOsageOttawaPaiutePakistaniPalestinianPanamanianParaguayanPennsylvania GermanPeruvianPimaPolishPortuguesePotawatomiPuebloPuerto RicanPuget Sound SalishRomanianRussianSalvadoranSamoanScandinavianScotch-IrishScottishSeminoleSenegaleseSerbianShoshoneSierra LeoneanSiouxSlavicSlovakSloveneSomaliSouth AfricanSouth AmericanSouth American IndianSoviet UnionSpaniardSpanishSpanish AmericanSpanish American IndianSri LankanSubsaharan AfricanSudaneseSwedishSwissSyrianTaiwaneseThaiTlingit-HaidaTohono O'OdhamTonganTrinidadian and TobagonianTsimshianTurkishU.S. Virgin IslanderUgandanUkrainianUruguayanUteVenezuelanVietnameseWelshWest IndianYakamaYaquiYugoslavianYumanYup'ikZimbabwean
Immigration
NonimmigrantsImmigrantsAfghanistanAfricaAlbaniaArgentinaArmeniaAsiaAustraliaAustriaBahamasBangladeshBarbadosBelarusBelgiumBelizeBoliviaBosnia and HerzegovinaBrazilBulgariaBurma/MyanmarCabo VerdeCambodiaCameroonCanadaCaribbeanCentral AmericaChileChinaColombiaCongoCosta RicaCroatiaCubaCzechoslovakiaDenmarkDominicaDominican RepublicEastern AfricaEastern AsiaEastern EuropeEcuadorEgyptEl SalvadorEnglandEritreaEthiopiaEuropeFijiFranceGermanyGhanaGreeceGrenadaGuatemalaGuyanaHaitiHondurasHong KongHungaryIndiaIndonesiaIranIraqIrelandIsraelItalyJamaicaJapanJordanKazakhstanKenyaKoreaKuwaitLaosLatin AmericaLatviaLebanonLiberiaLithuaniaMalaysiaMexicoMicronesiaMiddle AfricaMoldovaMoroccoNepalNetherlandsNicaraguaNigeriaNorth AmericaNorth MacedoniaNorthern AfricaNorthern EuropeNorwayOceaniaPakistanPanamaPeruPhilippinesPolandPortugalRomaniaRussiaSaudi ArabiaScotlandSenegalSerbiaSierra LeoneSingaporeSomaliaSouth AfricaSouth AmericaSouth Central AsiaSouth Eastern AsiaSouthern EuropeSpainSri LankaSt. Vincent and the GrenadinesSudanSwedenSwitzerlandSyriaTaiwanThailandTrinidad and TobagoTurkeyUgandaUkraineUruguayUzbekistanVenezuelaVietnamWest IndiesWestern AfricaWestern EuropeYemenZaireZimbabweAzores
Householder Income Ages 45 - 64 years
Income
Poverty
Unemployment
Labor Participation
Family Structure
Vehicle Availability
Education Level
Disability

Householder Income Ages 45 - 64 years Comparison

Immigrants from Western Asia

Immigrants from Nepal

Exceptional
Good
$106,217
HOUSEHOLDER INCOME AGES 45 - 64 YEARS
95.0/ 100
METRIC RATING
118th/ 347
METRIC RANK
$102,190
HOUSEHOLDER INCOME AGES 45 - 64 YEARS
71.8/ 100
METRIC RATING
161st/ 347
METRIC RANK

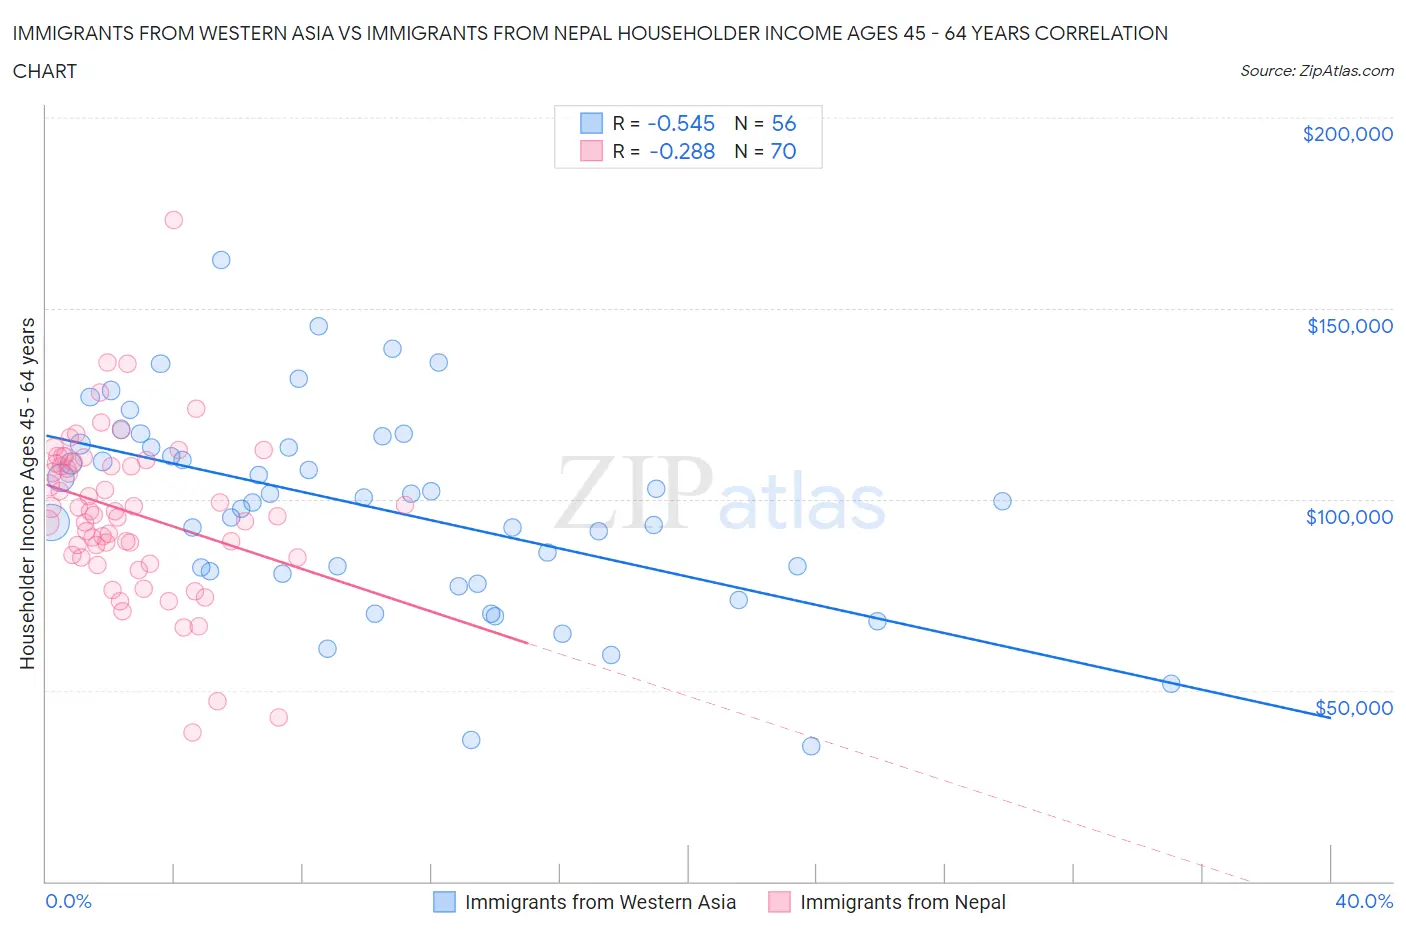
Immigrants from Western Asia vs Immigrants from Nepal Householder Income Ages 45 - 64 years Correlation Chart

The statistical analysis conducted on geographies consisting of 403,788,110 people shows a substantial negative correlation between the proportion of Immigrants from Western Asia and household income with householder between the ages 45 and 64 in the United States with a correlation coefficient (R) of -0.545 and weighted average of $106,217. Similarly, the statistical analysis conducted on geographies consisting of 186,605,051 people shows a weak negative correlation between the proportion of Immigrants from Nepal and household income with householder between the ages 45 and 64 in the United States with a correlation coefficient (R) of -0.288 and weighted average of $102,190, a difference of 3.9%.
Immigrants from Western Asia vs Immigrants from Nepal Householder Income Ages 45 - 64 years

Householder Income Ages 45 - 64 years Correlation Summary

MeasurementImmigrants from Western AsiaImmigrants from Nepal
Minimum$35,250$38,929
Maximum$162,741$173,233
Range$127,491$134,304
Mean$97,778$96,757
Median$100,060$96,927
Interquartile 25% (IQ1)$80,918$85,480
Interquartile 75% (IQ3)$113,930$109,661
Interquartile Range (IQR)$33,012$24,181
Standard Deviation (Sample)$26,213$21,222
Standard Deviation (Population)$25,977$21,070

Similar Demographics by Householder Income Ages 45 - 64 years

Demographics Similar to Immigrants from Western Asia by Householder Income Ages 45 - 64 years

In terms of householder income ages 45 - 64 years, the demographic groups most similar to Immigrants from Western Asia are Albanian ($106,243, a difference of 0.020%), British ($106,264, a difference of 0.040%), Immigrants from Jordan ($106,164, a difference of 0.050%), Immigrants from Kuwait ($106,285, a difference of 0.060%), and Immigrants from Poland ($106,319, a difference of 0.10%).
DemographicsRating | RankHouseholder Income Ages 45 - 64 years
Immigrants | Vietnam
95.5
/100
|
#111
Exceptional
$106,417
Swedes
95.4
/100
|
#112
Exceptional
$106,377
Europeans
95.4
/100
|
#113
Exceptional
$106,367
Immigrants | Poland
95.3
/100
|
#114
Exceptional
$106,319
Immigrants | Kuwait
95.2
/100
|
#115
Exceptional
$106,285
British
95.2
/100
|
#116
Exceptional
$106,264
Albanians
95.1
/100
|
#117
Exceptional
$106,243
Immigrants | Western Asia
95.0
/100
|
#118
Exceptional
$106,217
Immigrants | Jordan
94.9
/100
|
#119
Exceptional
$106,164
Immigrants | South Eastern Asia
94.8
/100
|
#120
Exceptional
$106,109
Poles
94.4
/100
|
#121
Exceptional
$105,952
Immigrants | North Macedonia
94.2
/100
|
#122
Exceptional
$105,892
Danes
93.4
/100
|
#123
Exceptional
$105,619
Immigrants | Northern Africa
92.8
/100
|
#124
Exceptional
$105,430
Pakistanis
92.4
/100
|
#125
Exceptional
$105,317

Demographics Similar to Immigrants from Nepal by Householder Income Ages 45 - 64 years

In terms of householder income ages 45 - 64 years, the demographic groups most similar to Immigrants from Nepal are Icelander ($102,261, a difference of 0.070%), Scottish ($102,123, a difference of 0.070%), English ($102,021, a difference of 0.17%), Immigrants from Morocco ($102,015, a difference of 0.17%), and Sierra Leonean ($102,427, a difference of 0.23%).
DemographicsRating | RankHouseholder Income Ages 45 - 64 years
Slovenes
78.3
/100
|
#154
Good
$102,885
Costa Ricans
77.4
/100
|
#155
Good
$102,779
Carpatho Rusyns
77.4
/100
|
#156
Good
$102,777
Immigrants | Ethiopia
77.3
/100
|
#157
Good
$102,763
Slavs
76.1
/100
|
#158
Good
$102,629
Sierra Leoneans
74.2
/100
|
#159
Good
$102,427
Icelanders
72.5
/100
|
#160
Good
$102,261
Immigrants | Nepal
71.8
/100
|
#161
Good
$102,190
Scottish
71.1
/100
|
#162
Good
$102,123
English
70.1
/100
|
#163
Good
$102,021
Immigrants | Morocco
70.0
/100
|
#164
Good
$102,015
Immigrants | Albania
69.4
/100
|
#165
Good
$101,957
Samoans
65.3
/100
|
#166
Good
$101,580
Czechoslovakians
63.0
/100
|
#167
Good
$101,387
South American Indians
60.5
/100
|
#168
Good
$101,171