Kiowa vs Immigrants from Brazil Median Family Income
COMPARE
Kiowa
Immigrants from Brazil
Median Family Income
Median Family Income Comparison
Kiowa
Immigrants from Brazil
$80,885
MEDIAN FAMILY INCOME
0.0/ 100
METRIC RATING
333rd/ 347
METRIC RANK
$109,418
MEDIAN FAMILY INCOME
96.9/ 100
METRIC RATING
103rd/ 347
METRIC RANK
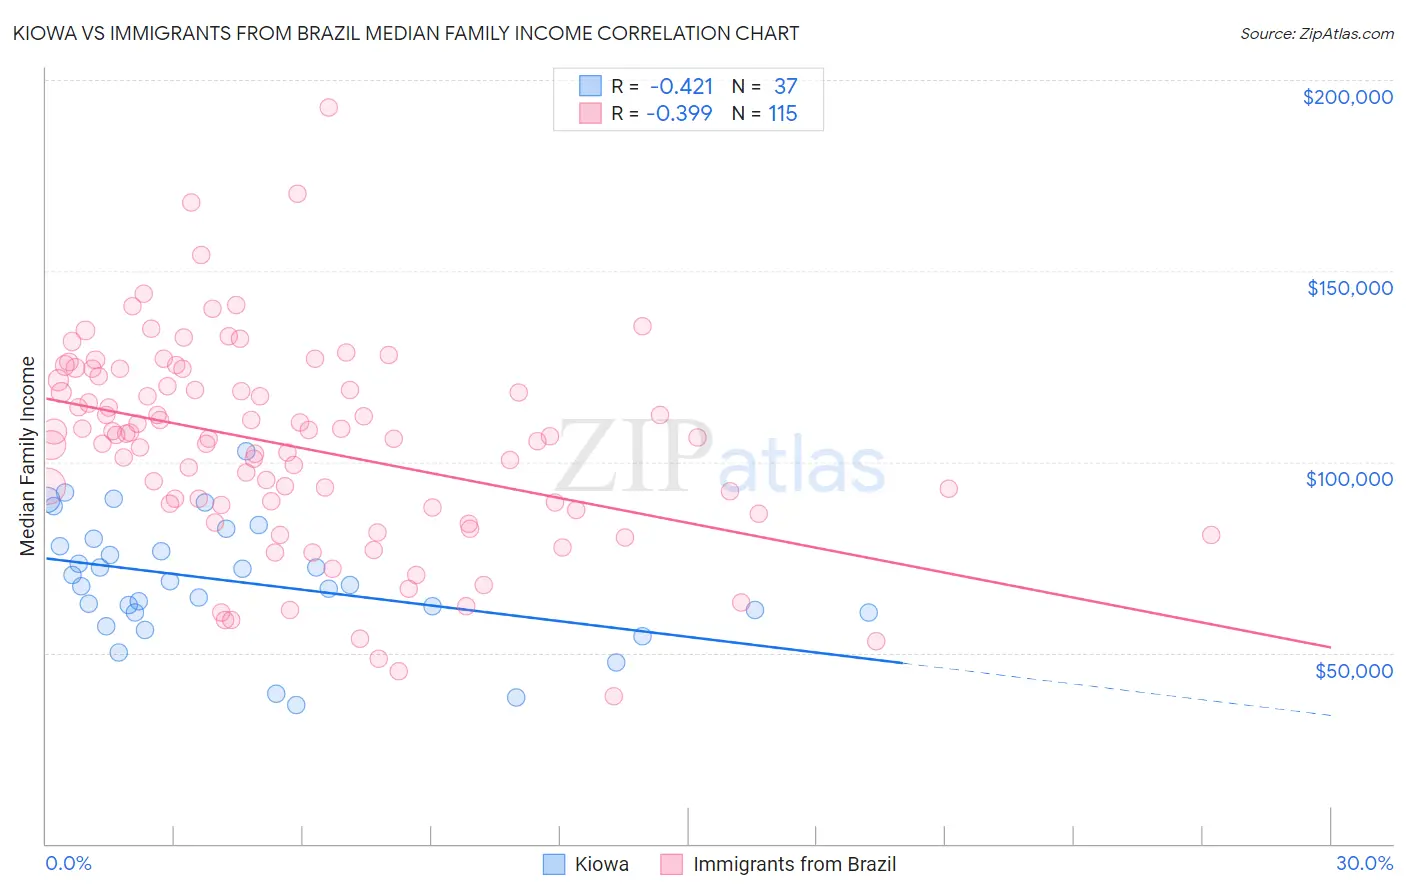
Kiowa vs Immigrants from Brazil Median Family Income Correlation Chart
The statistical analysis conducted on geographies consisting of 56,095,481 people shows a moderate negative correlation between the proportion of Kiowa and median family income in the United States with a correlation coefficient (R) of -0.421 and weighted average of $80,885. Similarly, the statistical analysis conducted on geographies consisting of 342,786,060 people shows a mild negative correlation between the proportion of Immigrants from Brazil and median family income in the United States with a correlation coefficient (R) of -0.399 and weighted average of $109,418, a difference of 35.3%.
Median Family Income Correlation Summary
| Measurement | Kiowa | Immigrants from Brazil |
| Minimum | $36,250 | $38,641 |
| Maximum | $102,708 | $192,802 |
| Range | $66,458 | $154,161 |
| Mean | $68,555 | $103,935 |
| Median | $67,750 | $106,400 |
| Interquartile 25% (IQ1) | $60,573 | $87,917 |
| Interquartile 75% (IQ3) | $79,021 | $121,341 |
| Interquartile Range (IQR) | $18,448 | $33,424 |
| Standard Deviation (Sample) | $15,572 | $26,654 |
| Standard Deviation (Population) | $15,360 | $26,538 |
Similar Demographics by Median Family Income
Demographics Similar to Kiowa by Median Family Income
In terms of median family income, the demographic groups most similar to Kiowa are Native/Alaskan ($80,908, a difference of 0.030%), Immigrants from Dominican Republic ($81,233, a difference of 0.43%), Cheyenne ($81,385, a difference of 0.62%), Dutch West Indian ($81,852, a difference of 1.2%), and Black/African American ($81,912, a difference of 1.3%).
| Demographics | Rating | Rank | Median Family Income |
| Immigrants | Congo | 0.0 /100 | #326 | Tragic $82,216 |
| Arapaho | 0.0 /100 | #327 | Tragic $82,064 |
| Blacks/African Americans | 0.0 /100 | #328 | Tragic $81,912 |
| Dutch West Indians | 0.0 /100 | #329 | Tragic $81,852 |
| Cheyenne | 0.0 /100 | #330 | Tragic $81,385 |
| Immigrants | Dominican Republic | 0.0 /100 | #331 | Tragic $81,233 |
| Natives/Alaskans | 0.0 /100 | #332 | Tragic $80,908 |
| Kiowa | 0.0 /100 | #333 | Tragic $80,885 |
| Menominee | 0.0 /100 | #334 | Tragic $79,563 |
| Yup'ik | 0.0 /100 | #335 | Tragic $79,290 |
| Immigrants | Cuba | 0.0 /100 | #336 | Tragic $78,249 |
| Yuman | 0.0 /100 | #337 | Tragic $78,055 |
| Immigrants | Yemen | 0.0 /100 | #338 | Tragic $77,457 |
| Pima | 0.0 /100 | #339 | Tragic $77,431 |
| Hopi | 0.0 /100 | #340 | Tragic $77,188 |
Demographics Similar to Immigrants from Brazil by Median Family Income
In terms of median family income, the demographic groups most similar to Immigrants from Brazil are Palestinian ($109,413, a difference of 0.0%), Syrian ($109,299, a difference of 0.11%), Assyrian/Chaldean/Syriac ($109,622, a difference of 0.19%), Immigrants from Ukraine ($109,645, a difference of 0.21%), and Macedonian ($109,668, a difference of 0.23%).
| Demographics | Rating | Rank | Median Family Income |
| Immigrants | Moldova | 97.7 /100 | #96 | Exceptional $109,975 |
| Jordanians | 97.5 /100 | #97 | Exceptional $109,865 |
| Immigrants | Kuwait | 97.4 /100 | #98 | Exceptional $109,731 |
| Armenians | 97.3 /100 | #99 | Exceptional $109,692 |
| Macedonians | 97.3 /100 | #100 | Exceptional $109,668 |
| Immigrants | Ukraine | 97.2 /100 | #101 | Exceptional $109,645 |
| Assyrians/Chaldeans/Syriacs | 97.2 /100 | #102 | Exceptional $109,622 |
| Immigrants | Brazil | 96.9 /100 | #103 | Exceptional $109,418 |
| Palestinians | 96.9 /100 | #104 | Exceptional $109,413 |
| Syrians | 96.7 /100 | #105 | Exceptional $109,299 |
| Albanians | 96.4 /100 | #106 | Exceptional $109,136 |
| Immigrants | North Macedonia | 96.4 /100 | #107 | Exceptional $109,136 |
| Immigrants | Zimbabwe | 95.9 /100 | #108 | Exceptional $108,830 |
| Immigrants | Afghanistan | 95.6 /100 | #109 | Exceptional $108,709 |
| British | 95.6 /100 | #110 | Exceptional $108,705 |