Kiowa vs German Median Family Income
COMPARE
Kiowa
German
Median Family Income
Median Family Income Comparison
Kiowa
Germans
$80,885
MEDIAN FAMILY INCOME
0.0/ 100
METRIC RATING
333rd/ 347
METRIC RANK
$102,254
MEDIAN FAMILY INCOME
44.6/ 100
METRIC RATING
177th/ 347
METRIC RANK
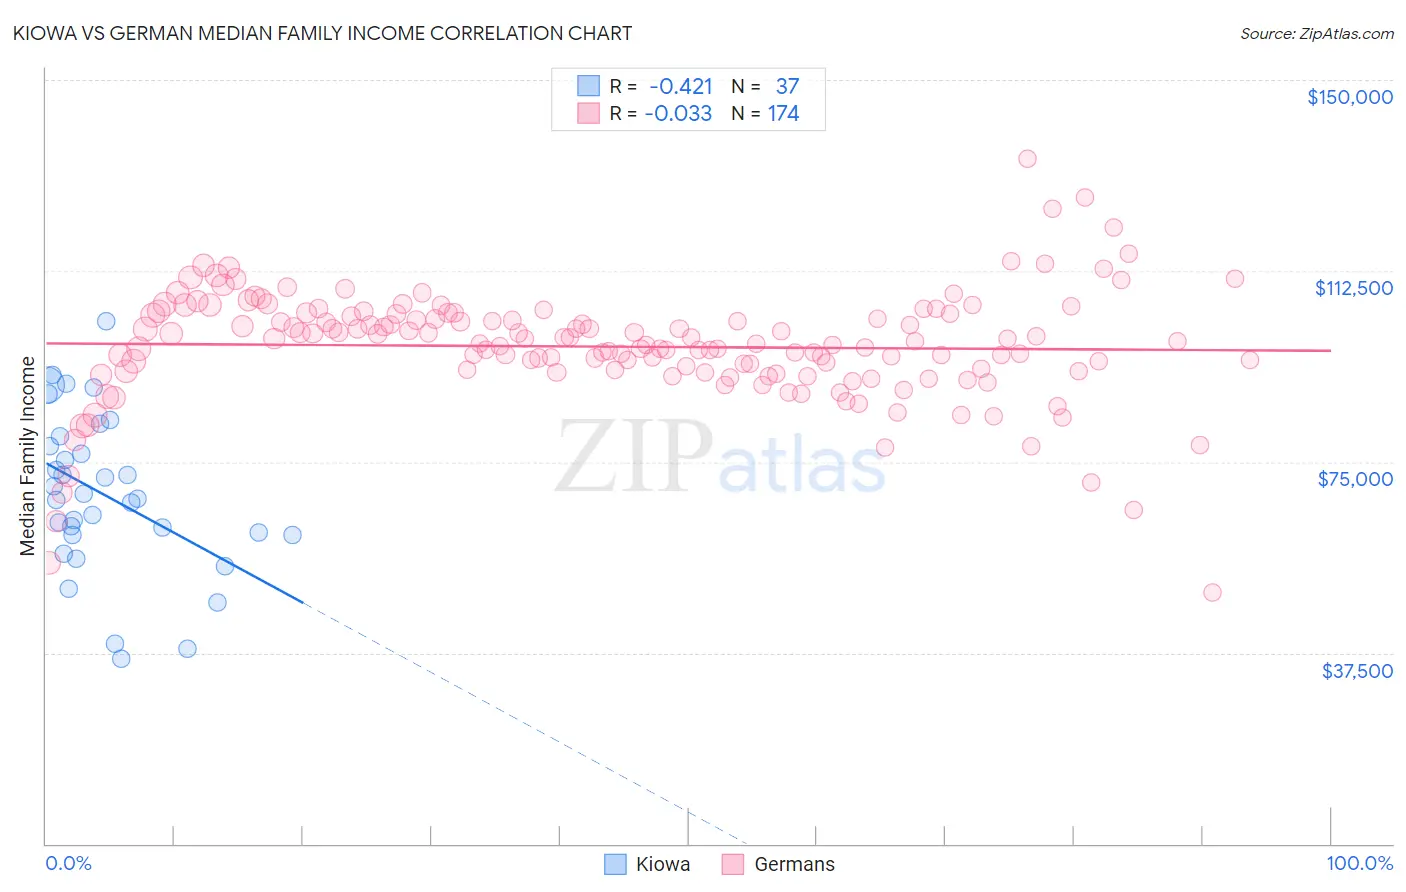
Kiowa vs German Median Family Income Correlation Chart
The statistical analysis conducted on geographies consisting of 56,095,481 people shows a moderate negative correlation between the proportion of Kiowa and median family income in the United States with a correlation coefficient (R) of -0.421 and weighted average of $80,885. Similarly, the statistical analysis conducted on geographies consisting of 579,235,453 people shows no correlation between the proportion of Germans and median family income in the United States with a correlation coefficient (R) of -0.033 and weighted average of $102,254, a difference of 26.4%.
Median Family Income Correlation Summary
| Measurement | Kiowa | German |
| Minimum | $36,250 | $49,444 |
| Maximum | $102,708 | $134,628 |
| Range | $66,458 | $85,184 |
| Mean | $68,555 | $97,641 |
| Median | $67,750 | $98,482 |
| Interquartile 25% (IQ1) | $60,573 | $92,833 |
| Interquartile 75% (IQ3) | $79,021 | $104,084 |
| Interquartile Range (IQR) | $18,448 | $11,251 |
| Standard Deviation (Sample) | $15,572 | $11,245 |
| Standard Deviation (Population) | $15,360 | $11,212 |
Similar Demographics by Median Family Income
Demographics Similar to Kiowa by Median Family Income
In terms of median family income, the demographic groups most similar to Kiowa are Native/Alaskan ($80,908, a difference of 0.030%), Immigrants from Dominican Republic ($81,233, a difference of 0.43%), Cheyenne ($81,385, a difference of 0.62%), Dutch West Indian ($81,852, a difference of 1.2%), and Black/African American ($81,912, a difference of 1.3%).
| Demographics | Rating | Rank | Median Family Income |
| Immigrants | Congo | 0.0 /100 | #326 | Tragic $82,216 |
| Arapaho | 0.0 /100 | #327 | Tragic $82,064 |
| Blacks/African Americans | 0.0 /100 | #328 | Tragic $81,912 |
| Dutch West Indians | 0.0 /100 | #329 | Tragic $81,852 |
| Cheyenne | 0.0 /100 | #330 | Tragic $81,385 |
| Immigrants | Dominican Republic | 0.0 /100 | #331 | Tragic $81,233 |
| Natives/Alaskans | 0.0 /100 | #332 | Tragic $80,908 |
| Kiowa | 0.0 /100 | #333 | Tragic $80,885 |
| Menominee | 0.0 /100 | #334 | Tragic $79,563 |
| Yup'ik | 0.0 /100 | #335 | Tragic $79,290 |
| Immigrants | Cuba | 0.0 /100 | #336 | Tragic $78,249 |
| Yuman | 0.0 /100 | #337 | Tragic $78,055 |
| Immigrants | Yemen | 0.0 /100 | #338 | Tragic $77,457 |
| Pima | 0.0 /100 | #339 | Tragic $77,431 |
| Hopi | 0.0 /100 | #340 | Tragic $77,188 |
Demographics Similar to Germans by Median Family Income
In terms of median family income, the demographic groups most similar to Germans are Welsh ($102,151, a difference of 0.10%), French ($102,368, a difference of 0.11%), Immigrants from Eastern Africa ($102,451, a difference of 0.19%), South American ($101,856, a difference of 0.39%), and Finnish ($102,676, a difference of 0.41%).
| Demographics | Rating | Rank | Median Family Income |
| Immigrants | Uzbekistan | 56.6 /100 | #170 | Average $103,197 |
| Alsatians | 54.3 /100 | #171 | Average $103,010 |
| Immigrants | Eritrea | 51.9 /100 | #172 | Average $102,823 |
| Belgians | 51.4 /100 | #173 | Average $102,788 |
| Finns | 50.0 /100 | #174 | Average $102,676 |
| Immigrants | Eastern Africa | 47.1 /100 | #175 | Average $102,451 |
| French | 46.1 /100 | #176 | Average $102,368 |
| Germans | 44.6 /100 | #177 | Average $102,254 |
| Welsh | 43.3 /100 | #178 | Average $102,151 |
| South Americans | 39.7 /100 | #179 | Fair $101,856 |
| French Canadians | 37.0 /100 | #180 | Fair $101,634 |
| Spaniards | 36.8 /100 | #181 | Fair $101,617 |
| Tsimshian | 35.9 /100 | #182 | Fair $101,543 |
| Kenyans | 34.5 /100 | #183 | Fair $101,417 |
| Immigrants | Costa Rica | 33.7 /100 | #184 | Fair $101,354 |