Kiowa vs Paraguayan Median Family Income
COMPARE
Kiowa
Paraguayan
Median Family Income
Median Family Income Comparison
Kiowa
Paraguayans
$80,885
MEDIAN FAMILY INCOME
0.0/ 100
METRIC RATING
333rd/ 347
METRIC RANK
$114,016
MEDIAN FAMILY INCOME
99.7/ 100
METRIC RATING
66th/ 347
METRIC RANK
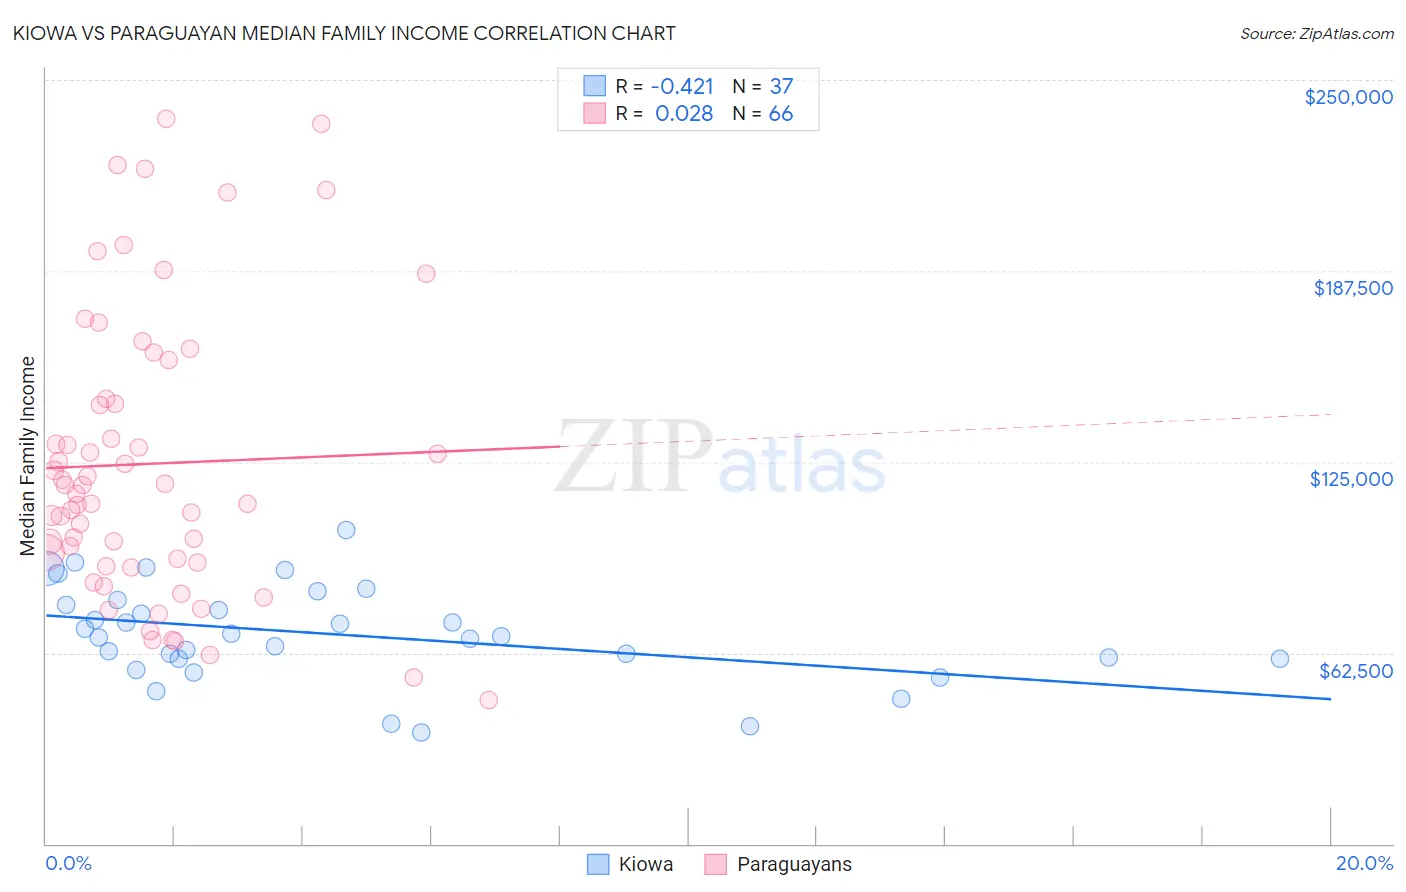
Kiowa vs Paraguayan Median Family Income Correlation Chart
The statistical analysis conducted on geographies consisting of 56,095,481 people shows a moderate negative correlation between the proportion of Kiowa and median family income in the United States with a correlation coefficient (R) of -0.421 and weighted average of $80,885. Similarly, the statistical analysis conducted on geographies consisting of 95,094,698 people shows no correlation between the proportion of Paraguayans and median family income in the United States with a correlation coefficient (R) of 0.028 and weighted average of $114,016, a difference of 41.0%.
Median Family Income Correlation Summary
| Measurement | Kiowa | Paraguayan |
| Minimum | $36,250 | $47,188 |
| Maximum | $102,708 | $237,188 |
| Range | $66,458 | $190,000 |
| Mean | $68,555 | $124,379 |
| Median | $67,750 | $115,994 |
| Interquartile 25% (IQ1) | $60,573 | $91,993 |
| Interquartile 75% (IQ3) | $79,021 | $145,560 |
| Interquartile Range (IQR) | $18,448 | $53,567 |
| Standard Deviation (Sample) | $15,572 | $46,622 |
| Standard Deviation (Population) | $15,360 | $46,268 |
Similar Demographics by Median Family Income
Demographics Similar to Kiowa by Median Family Income
In terms of median family income, the demographic groups most similar to Kiowa are Native/Alaskan ($80,908, a difference of 0.030%), Immigrants from Dominican Republic ($81,233, a difference of 0.43%), Cheyenne ($81,385, a difference of 0.62%), Dutch West Indian ($81,852, a difference of 1.2%), and Black/African American ($81,912, a difference of 1.3%).
| Demographics | Rating | Rank | Median Family Income |
| Immigrants | Congo | 0.0 /100 | #326 | Tragic $82,216 |
| Arapaho | 0.0 /100 | #327 | Tragic $82,064 |
| Blacks/African Americans | 0.0 /100 | #328 | Tragic $81,912 |
| Dutch West Indians | 0.0 /100 | #329 | Tragic $81,852 |
| Cheyenne | 0.0 /100 | #330 | Tragic $81,385 |
| Immigrants | Dominican Republic | 0.0 /100 | #331 | Tragic $81,233 |
| Natives/Alaskans | 0.0 /100 | #332 | Tragic $80,908 |
| Kiowa | 0.0 /100 | #333 | Tragic $80,885 |
| Menominee | 0.0 /100 | #334 | Tragic $79,563 |
| Yup'ik | 0.0 /100 | #335 | Tragic $79,290 |
| Immigrants | Cuba | 0.0 /100 | #336 | Tragic $78,249 |
| Yuman | 0.0 /100 | #337 | Tragic $78,055 |
| Immigrants | Yemen | 0.0 /100 | #338 | Tragic $77,457 |
| Pima | 0.0 /100 | #339 | Tragic $77,431 |
| Hopi | 0.0 /100 | #340 | Tragic $77,188 |
Demographics Similar to Paraguayans by Median Family Income
In terms of median family income, the demographic groups most similar to Paraguayans are Egyptian ($114,119, a difference of 0.090%), Immigrants from Spain ($113,815, a difference of 0.18%), Immigrants from Scotland ($114,392, a difference of 0.33%), Immigrants from Pakistan ($114,406, a difference of 0.34%), and Mongolian ($114,553, a difference of 0.47%).
| Demographics | Rating | Rank | Median Family Income |
| Immigrants | Netherlands | 99.8 /100 | #59 | Exceptional $114,987 |
| Immigrants | Latvia | 99.8 /100 | #60 | Exceptional $114,826 |
| Immigrants | Belarus | 99.8 /100 | #61 | Exceptional $114,586 |
| Mongolians | 99.8 /100 | #62 | Exceptional $114,553 |
| Immigrants | Pakistan | 99.8 /100 | #63 | Exceptional $114,406 |
| Immigrants | Scotland | 99.7 /100 | #64 | Exceptional $114,392 |
| Egyptians | 99.7 /100 | #65 | Exceptional $114,119 |
| Paraguayans | 99.7 /100 | #66 | Exceptional $114,016 |
| Immigrants | Spain | 99.7 /100 | #67 | Exceptional $113,815 |
| Immigrants | Serbia | 99.6 /100 | #68 | Exceptional $113,463 |
| Immigrants | Bulgaria | 99.6 /100 | #69 | Exceptional $113,461 |
| Immigrants | Romania | 99.6 /100 | #70 | Exceptional $113,434 |
| South Africans | 99.5 /100 | #71 | Exceptional $113,229 |
| Afghans | 99.5 /100 | #72 | Exceptional $112,971 |
| Laotians | 99.5 /100 | #73 | Exceptional $112,859 |