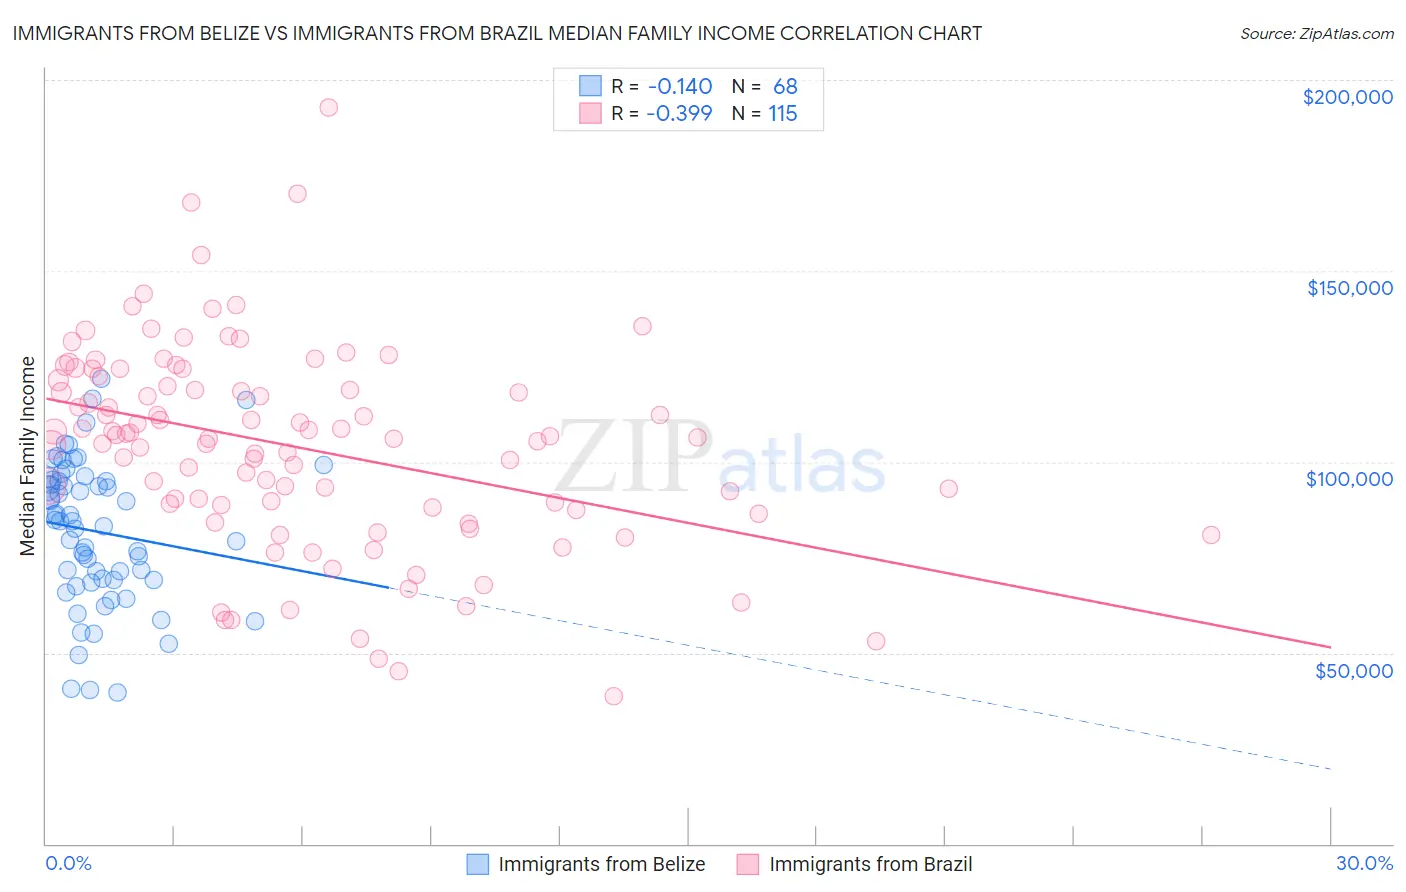
Immigrants from Belize vs Immigrants from Brazil Median Family Income
COMPARE
Immigrants from Belize
Immigrants from Brazil
Median Family Income
Median Family Income Comparison
Immigrants from Belize
Immigrants from Brazil
$89,197
MEDIAN FAMILY INCOME
0.1/ 100
METRIC RATING
279th/ 347
METRIC RANK
$109,418
MEDIAN FAMILY INCOME
96.9/ 100
METRIC RATING
103rd/ 347
METRIC RANK
Immigrants from Belize vs Immigrants from Brazil Median Family Income Correlation Chart
The statistical analysis conducted on geographies consisting of 130,266,359 people shows a poor negative correlation between the proportion of Immigrants from Belize and median family income in the United States with a correlation coefficient (R) of -0.140 and weighted average of $89,197. Similarly, the statistical analysis conducted on geographies consisting of 342,786,060 people shows a mild negative correlation between the proportion of Immigrants from Brazil and median family income in the United States with a correlation coefficient (R) of -0.399 and weighted average of $109,418, a difference of 22.7%.
Median Family Income Correlation Summary
| Measurement | Immigrants from Belize | Immigrants from Brazil |
| Minimum | $39,621 | $38,641 |
| Maximum | $121,707 | $192,802 |
| Range | $82,086 | $154,161 |
| Mean | $81,787 | $103,935 |
| Median | $84,449 | $106,400 |
| Interquartile 25% (IQ1) | $69,088 | $87,917 |
| Interquartile 75% (IQ3) | $95,112 | $121,341 |
| Interquartile Range (IQR) | $26,023 | $33,424 |
| Standard Deviation (Sample) | $18,723 | $26,654 |
| Standard Deviation (Population) | $18,585 | $26,538 |
Similar Demographics by Median Family Income
Demographics Similar to Immigrants from Belize by Median Family Income
In terms of median family income, the demographic groups most similar to Immigrants from Belize are Immigrants from Grenada ($89,249, a difference of 0.060%), Immigrants from Jamaica ($89,268, a difference of 0.080%), Immigrants from Zaire ($89,285, a difference of 0.10%), British West Indian ($88,987, a difference of 0.24%), and Blackfeet ($88,717, a difference of 0.54%).
| Demographics | Rating | Rank | Median Family Income |
| Immigrants | Liberia | 0.2 /100 | #272 | Tragic $90,450 |
| Immigrants | Micronesia | 0.2 /100 | #273 | Tragic $90,345 |
| Spanish Americans | 0.2 /100 | #274 | Tragic $90,322 |
| Immigrants | St. Vincent and the Grenadines | 0.2 /100 | #275 | Tragic $90,094 |
| Immigrants | Zaire | 0.1 /100 | #276 | Tragic $89,285 |
| Immigrants | Jamaica | 0.1 /100 | #277 | Tragic $89,268 |
| Immigrants | Grenada | 0.1 /100 | #278 | Tragic $89,249 |
| Immigrants | Belize | 0.1 /100 | #279 | Tragic $89,197 |
| British West Indians | 0.1 /100 | #280 | Tragic $88,987 |
| Blackfeet | 0.1 /100 | #281 | Tragic $88,717 |
| Comanche | 0.1 /100 | #282 | Tragic $88,556 |
| Bangladeshis | 0.1 /100 | #283 | Tragic $88,358 |
| Indonesians | 0.1 /100 | #284 | Tragic $88,301 |
| Guatemalans | 0.1 /100 | #285 | Tragic $88,295 |
| Immigrants | Nicaragua | 0.1 /100 | #286 | Tragic $88,267 |
Demographics Similar to Immigrants from Brazil by Median Family Income
In terms of median family income, the demographic groups most similar to Immigrants from Brazil are Palestinian ($109,413, a difference of 0.0%), Syrian ($109,299, a difference of 0.11%), Assyrian/Chaldean/Syriac ($109,622, a difference of 0.19%), Immigrants from Ukraine ($109,645, a difference of 0.21%), and Macedonian ($109,668, a difference of 0.23%).
| Demographics | Rating | Rank | Median Family Income |
| Immigrants | Moldova | 97.7 /100 | #96 | Exceptional $109,975 |
| Jordanians | 97.5 /100 | #97 | Exceptional $109,865 |
| Immigrants | Kuwait | 97.4 /100 | #98 | Exceptional $109,731 |
| Armenians | 97.3 /100 | #99 | Exceptional $109,692 |
| Macedonians | 97.3 /100 | #100 | Exceptional $109,668 |
| Immigrants | Ukraine | 97.2 /100 | #101 | Exceptional $109,645 |
| Assyrians/Chaldeans/Syriacs | 97.2 /100 | #102 | Exceptional $109,622 |
| Immigrants | Brazil | 96.9 /100 | #103 | Exceptional $109,418 |
| Palestinians | 96.9 /100 | #104 | Exceptional $109,413 |
| Syrians | 96.7 /100 | #105 | Exceptional $109,299 |
| Albanians | 96.4 /100 | #106 | Exceptional $109,136 |
| Immigrants | North Macedonia | 96.4 /100 | #107 | Exceptional $109,136 |
| Immigrants | Zimbabwe | 95.9 /100 | #108 | Exceptional $108,830 |
| Immigrants | Afghanistan | 95.6 /100 | #109 | Exceptional $108,709 |
| British | 95.6 /100 | #110 | Exceptional $108,705 |