Brazilian vs Immigrants from Brazil Median Family Income
COMPARE
Brazilian
Immigrants from Brazil
Median Family Income
Median Family Income Comparison
Brazilians
Immigrants from Brazil
$106,942
MEDIAN FAMILY INCOME
89.8/ 100
METRIC RATING
130th/ 347
METRIC RANK
$109,418
MEDIAN FAMILY INCOME
96.9/ 100
METRIC RATING
103rd/ 347
METRIC RANK
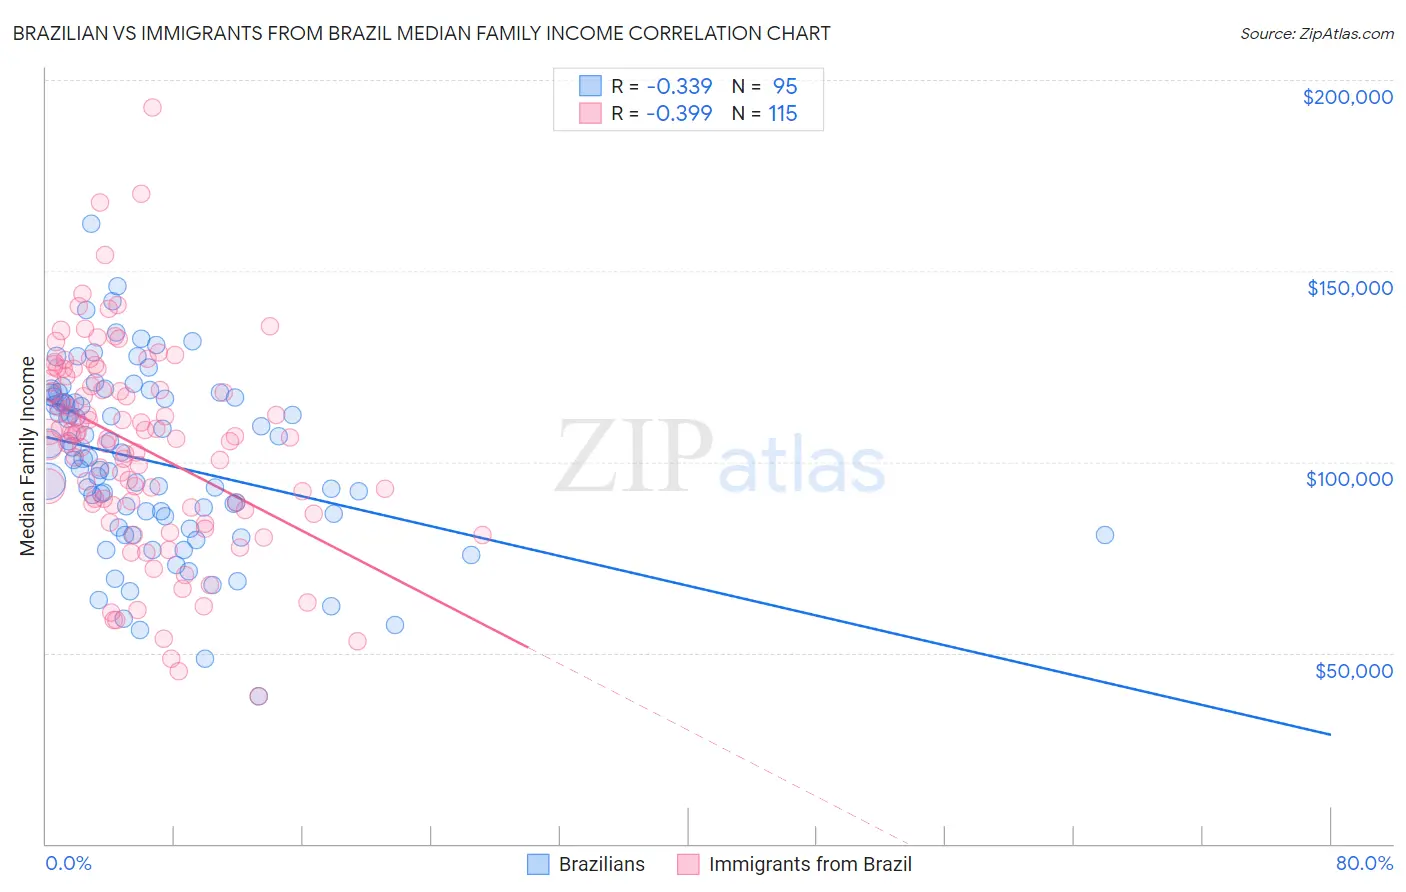
Brazilian vs Immigrants from Brazil Median Family Income Correlation Chart
The statistical analysis conducted on geographies consisting of 323,618,722 people shows a mild negative correlation between the proportion of Brazilians and median family income in the United States with a correlation coefficient (R) of -0.339 and weighted average of $106,942. Similarly, the statistical analysis conducted on geographies consisting of 342,786,060 people shows a mild negative correlation between the proportion of Immigrants from Brazil and median family income in the United States with a correlation coefficient (R) of -0.399 and weighted average of $109,418, a difference of 2.3%.
Median Family Income Correlation Summary
| Measurement | Brazilian | Immigrants from Brazil |
| Minimum | $38,641 | $38,641 |
| Maximum | $162,465 | $192,802 |
| Range | $123,824 | $154,161 |
| Mean | $99,932 | $103,935 |
| Median | $100,863 | $106,400 |
| Interquartile 25% (IQ1) | $82,900 | $87,917 |
| Interquartile 75% (IQ3) | $116,816 | $121,341 |
| Interquartile Range (IQR) | $33,916 | $33,424 |
| Standard Deviation (Sample) | $23,225 | $26,654 |
| Standard Deviation (Population) | $23,102 | $26,538 |
Similar Demographics by Median Family Income
Demographics Similar to Brazilians by Median Family Income
In terms of median family income, the demographic groups most similar to Brazilians are Arab ($106,952, a difference of 0.010%), Immigrants from Ethiopia ($106,969, a difference of 0.030%), Lebanese ($107,086, a difference of 0.13%), Serbian ($107,157, a difference of 0.20%), and Canadian ($106,597, a difference of 0.32%).
| Demographics | Rating | Rank | Median Family Income |
| Carpatho Rusyns | 92.2 /100 | #123 | Exceptional $107,502 |
| Pakistanis | 91.7 /100 | #124 | Exceptional $107,390 |
| Taiwanese | 91.4 /100 | #125 | Exceptional $107,295 |
| Serbians | 90.8 /100 | #126 | Exceptional $107,157 |
| Lebanese | 90.5 /100 | #127 | Exceptional $107,086 |
| Immigrants | Ethiopia | 90.0 /100 | #128 | Excellent $106,969 |
| Arabs | 89.9 /100 | #129 | Excellent $106,952 |
| Brazilians | 89.8 /100 | #130 | Excellent $106,942 |
| Canadians | 88.1 /100 | #131 | Excellent $106,597 |
| Immigrants | Fiji | 87.8 /100 | #132 | Excellent $106,544 |
| Ugandans | 87.8 /100 | #133 | Excellent $106,541 |
| Immigrants | Oceania | 87.3 /100 | #134 | Excellent $106,453 |
| Portuguese | 86.3 /100 | #135 | Excellent $106,286 |
| Immigrants | South Eastern Asia | 86.1 /100 | #136 | Excellent $106,252 |
| Immigrants | Uganda | 85.7 /100 | #137 | Excellent $106,188 |
Demographics Similar to Immigrants from Brazil by Median Family Income
In terms of median family income, the demographic groups most similar to Immigrants from Brazil are Palestinian ($109,413, a difference of 0.0%), Syrian ($109,299, a difference of 0.11%), Assyrian/Chaldean/Syriac ($109,622, a difference of 0.19%), Immigrants from Ukraine ($109,645, a difference of 0.21%), and Macedonian ($109,668, a difference of 0.23%).
| Demographics | Rating | Rank | Median Family Income |
| Immigrants | Moldova | 97.7 /100 | #96 | Exceptional $109,975 |
| Jordanians | 97.5 /100 | #97 | Exceptional $109,865 |
| Immigrants | Kuwait | 97.4 /100 | #98 | Exceptional $109,731 |
| Armenians | 97.3 /100 | #99 | Exceptional $109,692 |
| Macedonians | 97.3 /100 | #100 | Exceptional $109,668 |
| Immigrants | Ukraine | 97.2 /100 | #101 | Exceptional $109,645 |
| Assyrians/Chaldeans/Syriacs | 97.2 /100 | #102 | Exceptional $109,622 |
| Immigrants | Brazil | 96.9 /100 | #103 | Exceptional $109,418 |
| Palestinians | 96.9 /100 | #104 | Exceptional $109,413 |
| Syrians | 96.7 /100 | #105 | Exceptional $109,299 |
| Albanians | 96.4 /100 | #106 | Exceptional $109,136 |
| Immigrants | North Macedonia | 96.4 /100 | #107 | Exceptional $109,136 |
| Immigrants | Zimbabwe | 95.9 /100 | #108 | Exceptional $108,830 |
| Immigrants | Afghanistan | 95.6 /100 | #109 | Exceptional $108,709 |
| British | 95.6 /100 | #110 | Exceptional $108,705 |