Immigrants from Hungary vs Immigrants from Brazil Median Family Income
COMPARE
Immigrants from Hungary
Immigrants from Brazil
Median Family Income
Median Family Income Comparison
Immigrants from Hungary
Immigrants from Brazil
$111,378
MEDIAN FAMILY INCOME
98.8/ 100
METRIC RATING
84th/ 347
METRIC RANK
$109,418
MEDIAN FAMILY INCOME
96.9/ 100
METRIC RATING
103rd/ 347
METRIC RANK
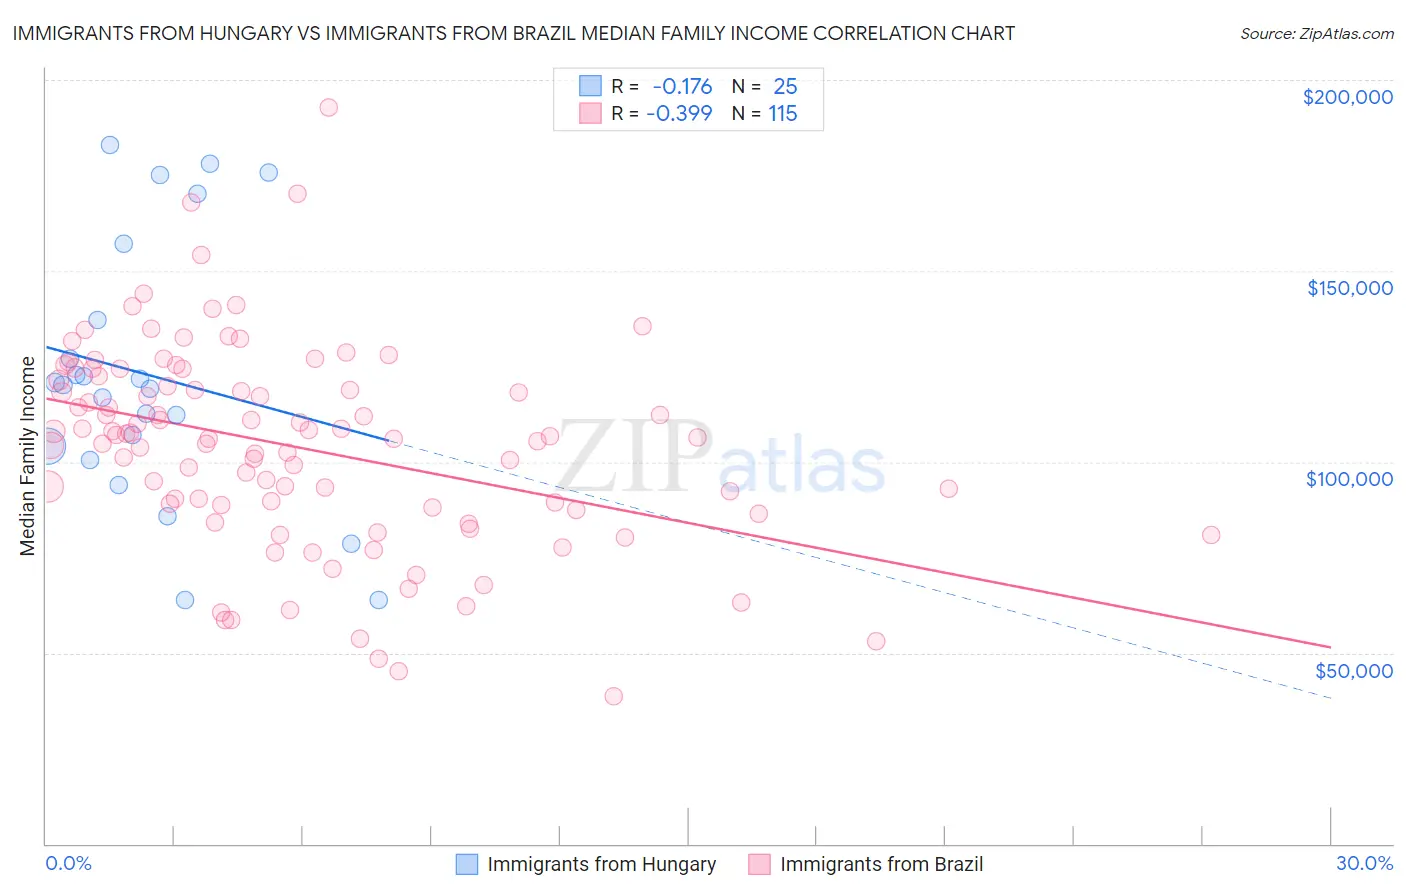
Immigrants from Hungary vs Immigrants from Brazil Median Family Income Correlation Chart
The statistical analysis conducted on geographies consisting of 195,642,900 people shows a poor negative correlation between the proportion of Immigrants from Hungary and median family income in the United States with a correlation coefficient (R) of -0.176 and weighted average of $111,378. Similarly, the statistical analysis conducted on geographies consisting of 342,786,060 people shows a mild negative correlation between the proportion of Immigrants from Brazil and median family income in the United States with a correlation coefficient (R) of -0.399 and weighted average of $109,418, a difference of 1.8%.
Median Family Income Correlation Summary
| Measurement | Immigrants from Hungary | Immigrants from Brazil |
| Minimum | $63,750 | $38,641 |
| Maximum | $183,055 | $192,802 |
| Range | $119,305 | $154,161 |
| Mean | $122,792 | $103,935 |
| Median | $120,051 | $106,400 |
| Interquartile 25% (IQ1) | $102,275 | $87,917 |
| Interquartile 75% (IQ3) | $147,198 | $121,341 |
| Interquartile Range (IQR) | $44,923 | $33,424 |
| Standard Deviation (Sample) | $34,384 | $26,654 |
| Standard Deviation (Population) | $33,690 | $26,538 |
Demographics Similar to Immigrants from Hungary and Immigrants from Brazil by Median Family Income
In terms of median family income, the demographic groups most similar to Immigrants from Hungary are Croatian ($111,370, a difference of 0.010%), Ukrainian ($111,368, a difference of 0.010%), Austrian ($111,306, a difference of 0.060%), Romanian ($111,243, a difference of 0.12%), and Immigrants from Egypt ($111,689, a difference of 0.28%). Similarly, the demographic groups most similar to Immigrants from Brazil are Assyrian/Chaldean/Syriac ($109,622, a difference of 0.19%), Immigrants from Ukraine ($109,645, a difference of 0.21%), Macedonian ($109,668, a difference of 0.23%), Armenian ($109,692, a difference of 0.25%), and Immigrants from Kuwait ($109,731, a difference of 0.29%).
| Demographics | Rating | Rank | Median Family Income |
| Immigrants | Egypt | 99.0 /100 | #83 | Exceptional $111,689 |
| Immigrants | Hungary | 98.8 /100 | #84 | Exceptional $111,378 |
| Croatians | 98.8 /100 | #85 | Exceptional $111,370 |
| Ukrainians | 98.8 /100 | #86 | Exceptional $111,368 |
| Austrians | 98.8 /100 | #87 | Exceptional $111,306 |
| Romanians | 98.8 /100 | #88 | Exceptional $111,243 |
| Immigrants | Argentina | 98.5 /100 | #89 | Exceptional $110,873 |
| Northern Europeans | 98.3 /100 | #90 | Exceptional $110,635 |
| Immigrants | Southern Europe | 98.3 /100 | #91 | Exceptional $110,614 |
| Immigrants | Lebanon | 97.9 /100 | #92 | Exceptional $110,159 |
| Immigrants | Kazakhstan | 97.8 /100 | #93 | Exceptional $110,137 |
| Koreans | 97.8 /100 | #94 | Exceptional $110,103 |
| Zimbabweans | 97.7 /100 | #95 | Exceptional $110,011 |
| Immigrants | Moldova | 97.7 /100 | #96 | Exceptional $109,975 |
| Jordanians | 97.5 /100 | #97 | Exceptional $109,865 |
| Immigrants | Kuwait | 97.4 /100 | #98 | Exceptional $109,731 |
| Armenians | 97.3 /100 | #99 | Exceptional $109,692 |
| Macedonians | 97.3 /100 | #100 | Exceptional $109,668 |
| Immigrants | Ukraine | 97.2 /100 | #101 | Exceptional $109,645 |
| Assyrians/Chaldeans/Syriacs | 97.2 /100 | #102 | Exceptional $109,622 |
| Immigrants | Brazil | 96.9 /100 | #103 | Exceptional $109,418 |