Kiowa vs Immigrants from Brazil Median Household Income
COMPARE
Kiowa
Immigrants from Brazil
Median Household Income
Median Household Income Comparison
Kiowa
Immigrants from Brazil
$65,914
MEDIAN HOUSEHOLD INCOME
0.0/ 100
METRIC RATING
337th/ 347
METRIC RANK
$90,907
MEDIAN HOUSEHOLD INCOME
97.7/ 100
METRIC RATING
105th/ 347
METRIC RANK
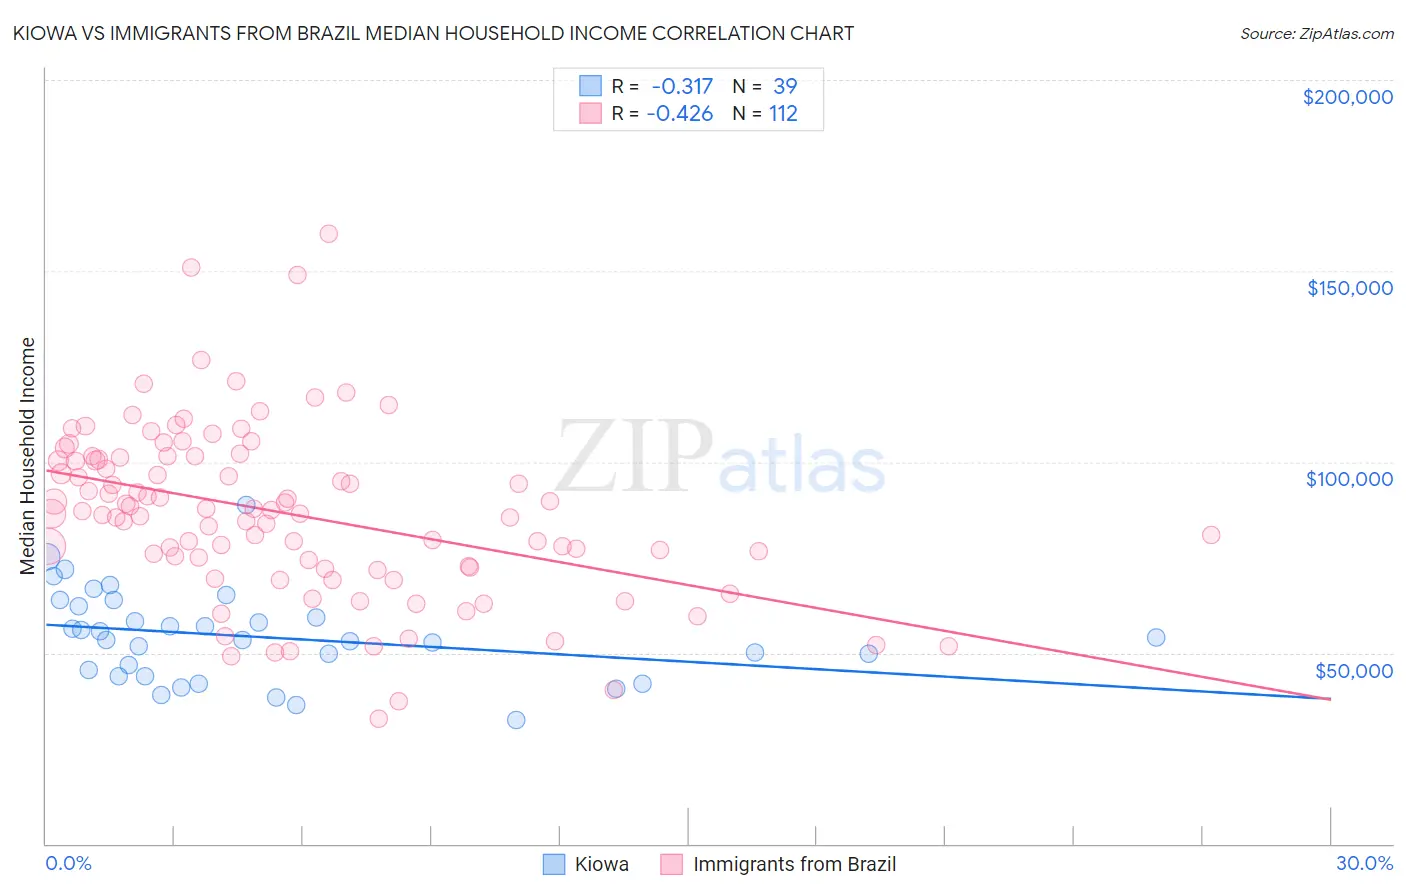
Kiowa vs Immigrants from Brazil Median Household Income Correlation Chart
The statistical analysis conducted on geographies consisting of 56,098,760 people shows a mild negative correlation between the proportion of Kiowa and median household income in the United States with a correlation coefficient (R) of -0.317 and weighted average of $65,914. Similarly, the statistical analysis conducted on geographies consisting of 342,806,589 people shows a moderate negative correlation between the proportion of Immigrants from Brazil and median household income in the United States with a correlation coefficient (R) of -0.426 and weighted average of $90,907, a difference of 37.9%.
Median Household Income Correlation Summary
| Measurement | Kiowa | Immigrants from Brazil |
| Minimum | $32,500 | $32,591 |
| Maximum | $88,558 | $159,719 |
| Range | $56,058 | $127,128 |
| Mean | $54,131 | $86,451 |
| Median | $53,438 | $86,864 |
| Interquartile 25% (IQ1) | $43,977 | $72,377 |
| Interquartile 75% (IQ3) | $62,181 | $100,910 |
| Interquartile Range (IQR) | $18,204 | $28,533 |
| Standard Deviation (Sample) | $11,836 | $22,561 |
| Standard Deviation (Population) | $11,684 | $22,460 |
Similar Demographics by Median Household Income
Demographics Similar to Kiowa by Median Household Income
In terms of median household income, the demographic groups most similar to Kiowa are Immigrants from Yemen ($65,194, a difference of 1.1%), Immigrants from Congo ($66,768, a difference of 1.3%), Hopi ($65,043, a difference of 1.3%), Cheyenne ($66,974, a difference of 1.6%), and Pueblo ($64,692, a difference of 1.9%).
| Demographics | Rating | Rank | Median Household Income |
| Arapaho | 0.0 /100 | #330 | Tragic $67,965 |
| Natives/Alaskans | 0.0 /100 | #331 | Tragic $67,879 |
| Sioux | 0.0 /100 | #332 | Tragic $67,792 |
| Creek | 0.0 /100 | #333 | Tragic $67,715 |
| Blacks/African Americans | 0.0 /100 | #334 | Tragic $67,573 |
| Cheyenne | 0.0 /100 | #335 | Tragic $66,974 |
| Immigrants | Congo | 0.0 /100 | #336 | Tragic $66,768 |
| Kiowa | 0.0 /100 | #337 | Tragic $65,914 |
| Immigrants | Yemen | 0.0 /100 | #338 | Tragic $65,194 |
| Hopi | 0.0 /100 | #339 | Tragic $65,043 |
| Pueblo | 0.0 /100 | #340 | Tragic $64,692 |
| Crow | 0.0 /100 | #341 | Tragic $63,681 |
| Pima | 0.0 /100 | #342 | Tragic $63,262 |
| Houma | 0.0 /100 | #343 | Tragic $62,575 |
| Tohono O'odham | 0.0 /100 | #344 | Tragic $61,663 |
Demographics Similar to Immigrants from Brazil by Median Household Income
In terms of median household income, the demographic groups most similar to Immigrants from Brazil are Immigrants from Kazakhstan ($91,015, a difference of 0.12%), Macedonian ($90,761, a difference of 0.16%), Immigrants from Ukraine ($91,124, a difference of 0.24%), Croatian ($90,685, a difference of 0.25%), and Zimbabwean ($90,618, a difference of 0.32%).
| Demographics | Rating | Rank | Median Household Income |
| Immigrants | Southern Europe | 98.5 /100 | #98 | Exceptional $91,605 |
| Immigrants | South Eastern Asia | 98.4 /100 | #99 | Exceptional $91,541 |
| Ukrainians | 98.3 /100 | #100 | Exceptional $91,456 |
| Immigrants | Moldova | 98.3 /100 | #101 | Exceptional $91,446 |
| Austrians | 98.2 /100 | #102 | Exceptional $91,339 |
| Immigrants | Ukraine | 98.0 /100 | #103 | Exceptional $91,124 |
| Immigrants | Kazakhstan | 97.8 /100 | #104 | Exceptional $91,015 |
| Immigrants | Brazil | 97.7 /100 | #105 | Exceptional $90,907 |
| Macedonians | 97.4 /100 | #106 | Exceptional $90,761 |
| Croatians | 97.3 /100 | #107 | Exceptional $90,685 |
| Zimbabweans | 97.2 /100 | #108 | Exceptional $90,618 |
| Chileans | 97.2 /100 | #109 | Exceptional $90,605 |
| Palestinians | 97.1 /100 | #110 | Exceptional $90,574 |
| Immigrants | Poland | 97.1 /100 | #111 | Exceptional $90,549 |
| Northern Europeans | 96.9 /100 | #112 | Exceptional $90,446 |