Kiowa vs Carpatho Rusyn Wage/Income Gap
COMPARE
Kiowa
Carpatho Rusyn
Wage/Income Gap
Wage/Income Gap Comparison
Kiowa
Carpatho Rusyns
23.6%
WAGE/INCOME GAP
99.4/ 100
METRIC RATING
96th/ 347
METRIC RANK
27.3%
WAGE/INCOME GAP
2.7/ 100
METRIC RATING
249th/ 347
METRIC RANK
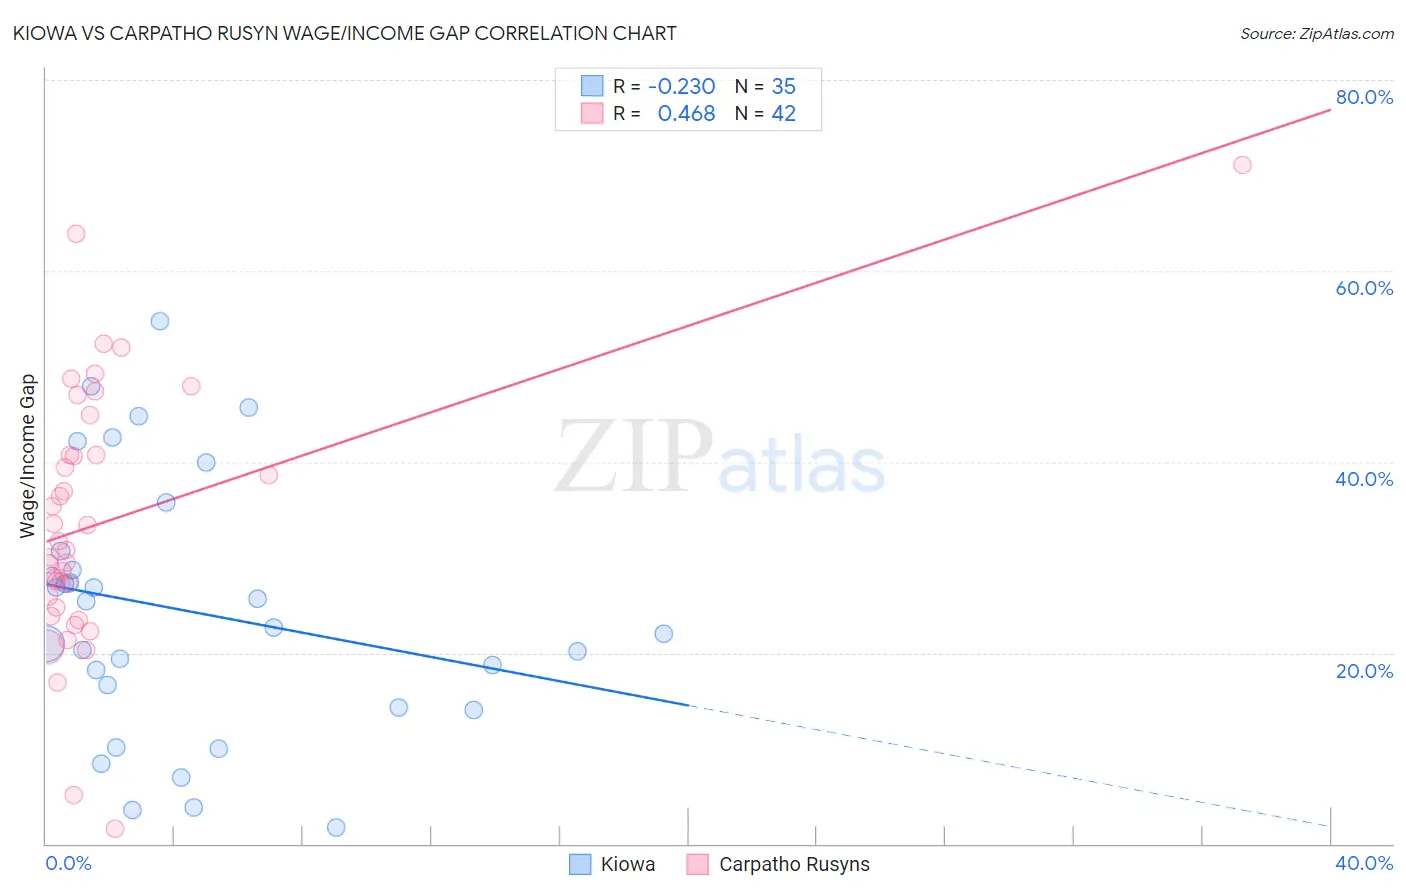
Kiowa vs Carpatho Rusyn Wage/Income Gap Correlation Chart
The statistical analysis conducted on geographies consisting of 56,090,422 people shows a weak negative correlation between the proportion of Kiowa and wage/income gap percentage in the United States with a correlation coefficient (R) of -0.230 and weighted average of 23.6%. Similarly, the statistical analysis conducted on geographies consisting of 58,862,775 people shows a moderate positive correlation between the proportion of Carpatho Rusyns and wage/income gap percentage in the United States with a correlation coefficient (R) of 0.468 and weighted average of 27.3%, a difference of 15.5%.
Wage/Income Gap Correlation Summary
| Measurement | Kiowa | Carpatho Rusyn |
| Minimum | 1.7% | 1.6% |
| Maximum | 54.7% | 71.2% |
| Range | 53.0% | 69.5% |
| Mean | 24.3% | 33.8% |
| Median | 22.6% | 31.3% |
| Interquartile 25% (IQ1) | 14.2% | 24.7% |
| Interquartile 75% (IQ3) | 30.6% | 40.7% |
| Interquartile Range (IQR) | 16.4% | 16.0% |
| Standard Deviation (Sample) | 13.5% | 13.8% |
| Standard Deviation (Population) | 13.3% | 13.7% |
Similar Demographics by Wage/Income Gap
Demographics Similar to Kiowa by Wage/Income Gap
In terms of wage/income gap, the demographic groups most similar to Kiowa are Immigrants from Sudan (23.6%, a difference of 0.090%), Cape Verdean (23.6%, a difference of 0.12%), Honduran (23.6%, a difference of 0.15%), Immigrants from Cabo Verde (23.6%, a difference of 0.24%), and Immigrants from Latin America (23.7%, a difference of 0.48%).
| Demographics | Rating | Rank | Wage/Income Gap |
| Marshallese | 99.6 /100 | #89 | Exceptional 23.4% |
| Nicaraguans | 99.6 /100 | #90 | Exceptional 23.4% |
| Arapaho | 99.6 /100 | #91 | Exceptional 23.5% |
| Immigrants | Honduras | 99.5 /100 | #92 | Exceptional 23.5% |
| Immigrants | Cabo Verde | 99.5 /100 | #93 | Exceptional 23.6% |
| Hondurans | 99.5 /100 | #94 | Exceptional 23.6% |
| Cape Verdeans | 99.4 /100 | #95 | Exceptional 23.6% |
| Kiowa | 99.4 /100 | #96 | Exceptional 23.6% |
| Immigrants | Sudan | 99.4 /100 | #97 | Exceptional 23.6% |
| Immigrants | Latin America | 99.2 /100 | #98 | Exceptional 23.7% |
| Aleuts | 99.2 /100 | #99 | Exceptional 23.7% |
| Yakama | 99.2 /100 | #100 | Exceptional 23.7% |
| Japanese | 99.1 /100 | #101 | Exceptional 23.8% |
| Immigrants | Laos | 99.0 /100 | #102 | Exceptional 23.8% |
| Tsimshian | 98.9 /100 | #103 | Exceptional 23.9% |
Demographics Similar to Carpatho Rusyns by Wage/Income Gap
In terms of wage/income gap, the demographic groups most similar to Carpatho Rusyns are Cypriot (27.3%, a difference of 0.0%), Celtic (27.3%, a difference of 0.020%), Immigrants from Czechoslovakia (27.3%, a difference of 0.020%), Immigrants from Norway (27.3%, a difference of 0.12%), and Ukrainian (27.3%, a difference of 0.18%).
| Demographics | Rating | Rank | Wage/Income Gap |
| Immigrants | Sri Lanka | 3.7 /100 | #242 | Tragic 27.1% |
| Spanish | 3.6 /100 | #243 | Tragic 27.1% |
| Chickasaw | 3.5 /100 | #244 | Tragic 27.2% |
| Immigrants | Azores | 3.5 /100 | #245 | Tragic 27.2% |
| Immigrants | Nonimmigrants | 3.3 /100 | #246 | Tragic 27.2% |
| Celtics | 2.8 /100 | #247 | Tragic 27.3% |
| Cypriots | 2.8 /100 | #248 | Tragic 27.3% |
| Carpatho Rusyns | 2.7 /100 | #249 | Tragic 27.3% |
| Immigrants | Czechoslovakia | 2.7 /100 | #250 | Tragic 27.3% |
| Immigrants | Norway | 2.5 /100 | #251 | Tragic 27.3% |
| Ukrainians | 2.4 /100 | #252 | Tragic 27.3% |
| Portuguese | 2.2 /100 | #253 | Tragic 27.4% |
| Israelis | 2.1 /100 | #254 | Tragic 27.4% |
| Immigrants | France | 2.1 /100 | #255 | Tragic 27.4% |
| Cherokee | 1.9 /100 | #256 | Tragic 27.4% |