Croatian vs Carpatho Rusyn Wage/Income Gap
COMPARE
Croatian
Carpatho Rusyn
Wage/Income Gap
Wage/Income Gap Comparison
Croatians
Carpatho Rusyns
29.0%
WAGE/INCOME GAP
0.0/ 100
METRIC RATING
324th/ 347
METRIC RANK
27.3%
WAGE/INCOME GAP
2.7/ 100
METRIC RATING
249th/ 347
METRIC RANK
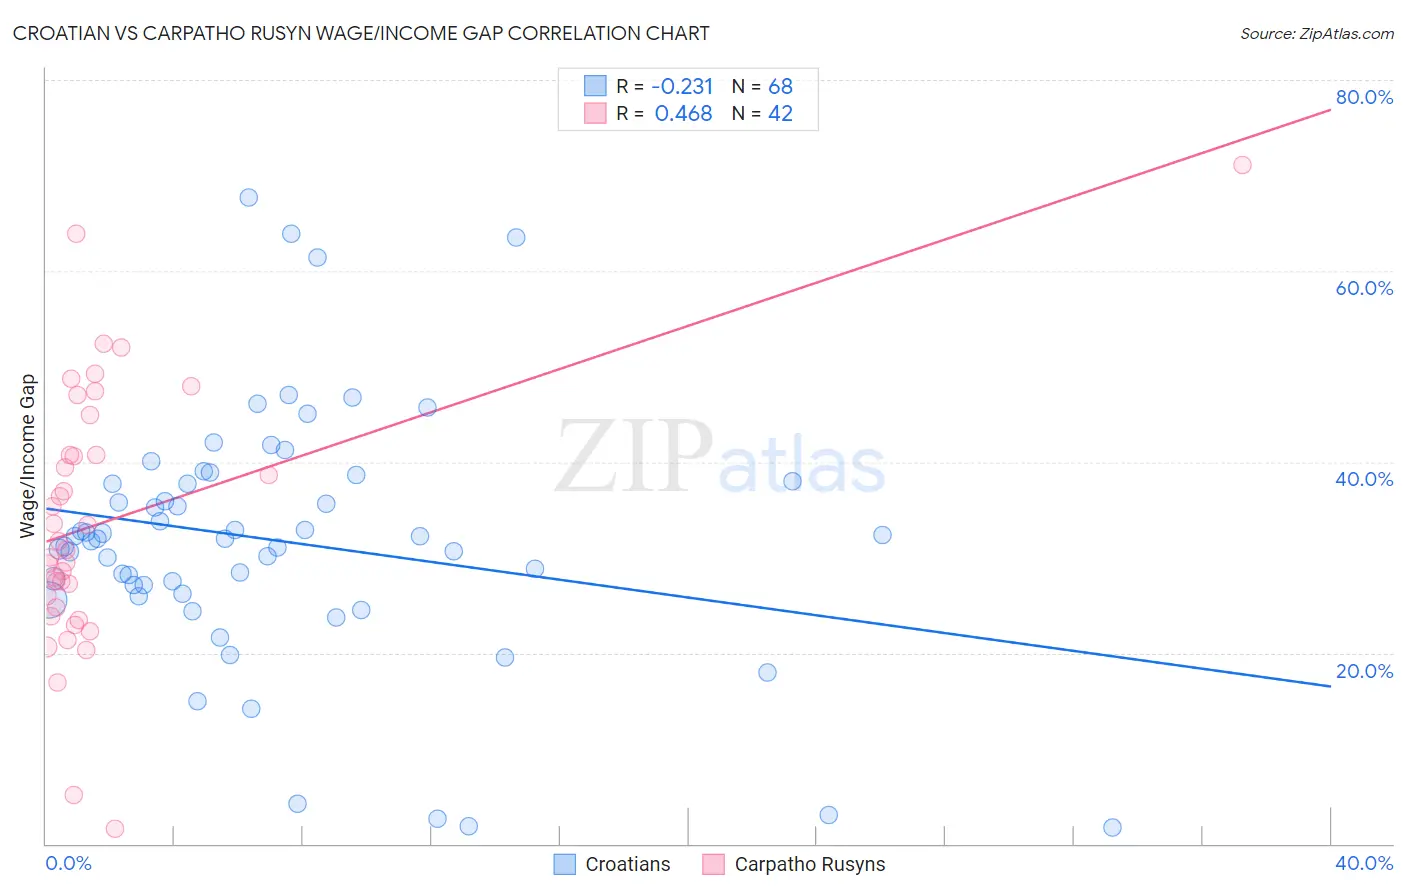
Croatian vs Carpatho Rusyn Wage/Income Gap Correlation Chart
The statistical analysis conducted on geographies consisting of 375,417,057 people shows a weak negative correlation between the proportion of Croatians and wage/income gap percentage in the United States with a correlation coefficient (R) of -0.231 and weighted average of 29.0%. Similarly, the statistical analysis conducted on geographies consisting of 58,862,775 people shows a moderate positive correlation between the proportion of Carpatho Rusyns and wage/income gap percentage in the United States with a correlation coefficient (R) of 0.468 and weighted average of 27.3%, a difference of 6.3%.
Wage/Income Gap Correlation Summary
| Measurement | Croatian | Carpatho Rusyn |
| Minimum | 1.8% | 1.6% |
| Maximum | 67.7% | 71.2% |
| Range | 65.9% | 69.5% |
| Mean | 31.7% | 33.8% |
| Median | 31.9% | 31.3% |
| Interquartile 25% (IQ1) | 26.6% | 24.7% |
| Interquartile 75% (IQ3) | 37.8% | 40.7% |
| Interquartile Range (IQR) | 11.2% | 16.0% |
| Standard Deviation (Sample) | 13.2% | 13.8% |
| Standard Deviation (Population) | 13.2% | 13.7% |
Similar Demographics by Wage/Income Gap
Demographics Similar to Croatians by Wage/Income Gap
In terms of wage/income gap, the demographic groups most similar to Croatians are Norwegian (29.0%, a difference of 0.12%), Hungarian (29.0%, a difference of 0.13%), Immigrants from Belgium (29.0%, a difference of 0.20%), Immigrants from Singapore (28.9%, a difference of 0.23%), and Welsh (28.9%, a difference of 0.25%).
| Demographics | Rating | Rank | Wage/Income Gap |
| Belgians | 0.1 /100 | #317 | Tragic 28.8% |
| Basques | 0.1 /100 | #318 | Tragic 28.8% |
| Slovaks | 0.1 /100 | #319 | Tragic 28.9% |
| British | 0.1 /100 | #320 | Tragic 28.9% |
| Welsh | 0.1 /100 | #321 | Tragic 28.9% |
| Immigrants | Singapore | 0.1 /100 | #322 | Tragic 28.9% |
| Norwegians | 0.1 /100 | #323 | Tragic 29.0% |
| Croatians | 0.0 /100 | #324 | Tragic 29.0% |
| Hungarians | 0.0 /100 | #325 | Tragic 29.0% |
| Immigrants | Belgium | 0.0 /100 | #326 | Tragic 29.0% |
| Immigrants | Iran | 0.0 /100 | #327 | Tragic 29.1% |
| Scandinavians | 0.0 /100 | #328 | Tragic 29.1% |
| Scottish | 0.0 /100 | #329 | Tragic 29.1% |
| Germans | 0.0 /100 | #330 | Tragic 29.2% |
| Czechs | 0.0 /100 | #331 | Tragic 29.2% |
Demographics Similar to Carpatho Rusyns by Wage/Income Gap
In terms of wage/income gap, the demographic groups most similar to Carpatho Rusyns are Cypriot (27.3%, a difference of 0.0%), Celtic (27.3%, a difference of 0.020%), Immigrants from Czechoslovakia (27.3%, a difference of 0.020%), Immigrants from Norway (27.3%, a difference of 0.12%), and Ukrainian (27.3%, a difference of 0.18%).
| Demographics | Rating | Rank | Wage/Income Gap |
| Immigrants | Sri Lanka | 3.7 /100 | #242 | Tragic 27.1% |
| Spanish | 3.6 /100 | #243 | Tragic 27.1% |
| Chickasaw | 3.5 /100 | #244 | Tragic 27.2% |
| Immigrants | Azores | 3.5 /100 | #245 | Tragic 27.2% |
| Immigrants | Nonimmigrants | 3.3 /100 | #246 | Tragic 27.2% |
| Celtics | 2.8 /100 | #247 | Tragic 27.3% |
| Cypriots | 2.8 /100 | #248 | Tragic 27.3% |
| Carpatho Rusyns | 2.7 /100 | #249 | Tragic 27.3% |
| Immigrants | Czechoslovakia | 2.7 /100 | #250 | Tragic 27.3% |
| Immigrants | Norway | 2.5 /100 | #251 | Tragic 27.3% |
| Ukrainians | 2.4 /100 | #252 | Tragic 27.3% |
| Portuguese | 2.2 /100 | #253 | Tragic 27.4% |
| Israelis | 2.1 /100 | #254 | Tragic 27.4% |
| Immigrants | France | 2.1 /100 | #255 | Tragic 27.4% |
| Cherokee | 1.9 /100 | #256 | Tragic 27.4% |