Kenyan vs Native Hawaiian Median Male Earnings
COMPARE
Kenyan
Native Hawaiian
Median Male Earnings
Median Male Earnings Comparison
Kenyans
Native Hawaiians
$53,647
MEDIAN MALE EARNINGS
30.4/ 100
METRIC RATING
193rd/ 347
METRIC RANK
$52,306
MEDIAN MALE EARNINGS
10.5/ 100
METRIC RATING
213th/ 347
METRIC RANK
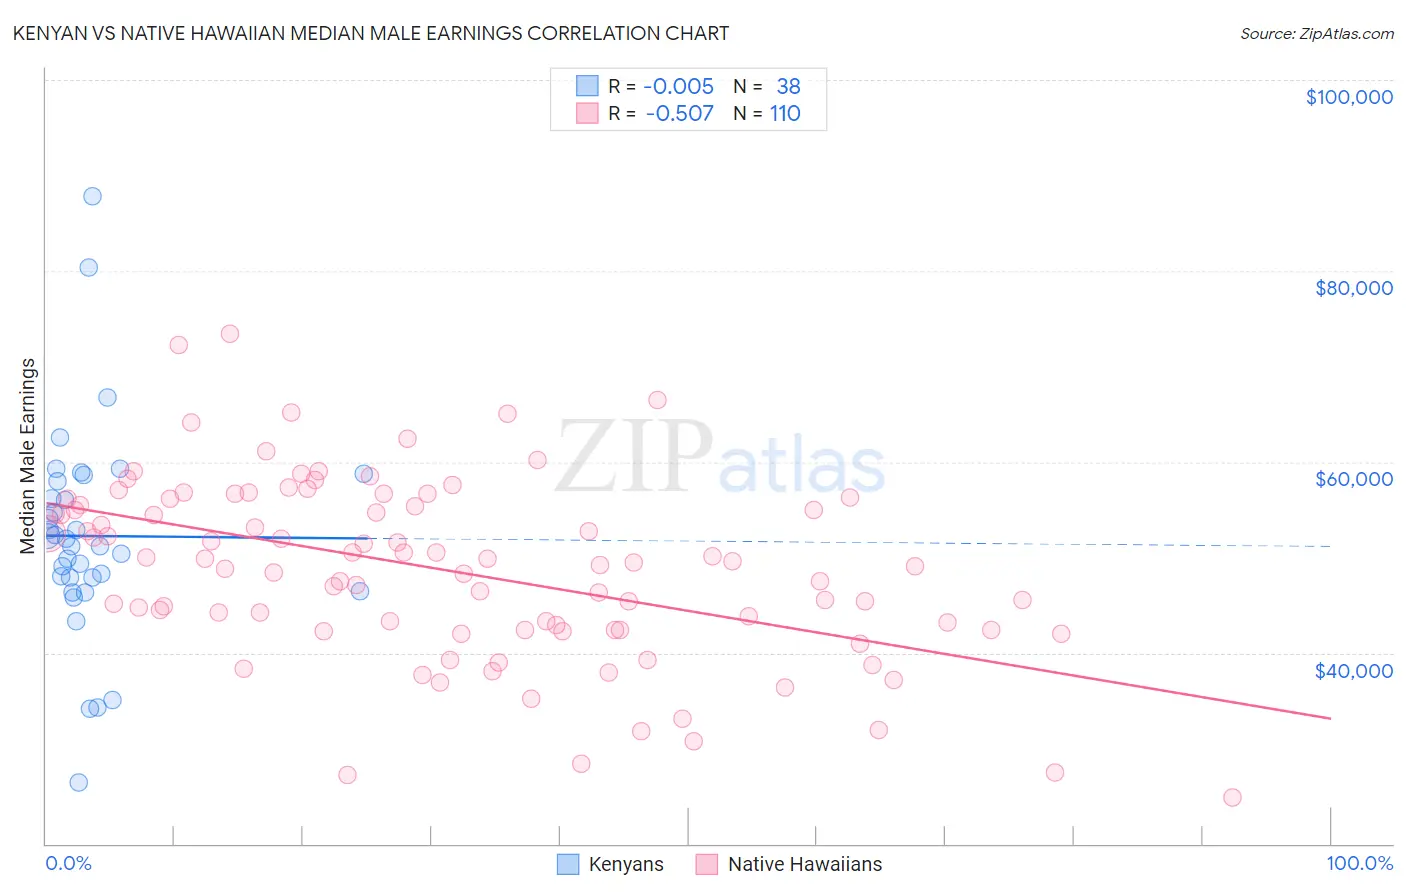
Kenyan vs Native Hawaiian Median Male Earnings Correlation Chart
The statistical analysis conducted on geographies consisting of 168,231,087 people shows no correlation between the proportion of Kenyans and median male earnings in the United States with a correlation coefficient (R) of -0.005 and weighted average of $53,647. Similarly, the statistical analysis conducted on geographies consisting of 332,009,259 people shows a substantial negative correlation between the proportion of Native Hawaiians and median male earnings in the United States with a correlation coefficient (R) of -0.507 and weighted average of $52,306, a difference of 2.6%.
Median Male Earnings Correlation Summary
| Measurement | Kenyan | Native Hawaiian |
| Minimum | $26,389 | $24,830 |
| Maximum | $87,784 | $73,412 |
| Range | $61,395 | $48,582 |
| Mean | $52,229 | $48,621 |
| Median | $51,523 | $49,328 |
| Interquartile 25% (IQ1) | $47,893 | $42,387 |
| Interquartile 75% (IQ3) | $57,971 | $55,422 |
| Interquartile Range (IQR) | $10,078 | $13,035 |
| Standard Deviation (Sample) | $11,163 | $9,458 |
| Standard Deviation (Population) | $11,016 | $9,414 |
Demographics Similar to Kenyans and Native Hawaiians by Median Male Earnings
In terms of median male earnings, the demographic groups most similar to Kenyans are Spanish ($53,576, a difference of 0.13%), Immigrants from the Azores ($53,503, a difference of 0.27%), Immigrants from Africa ($53,457, a difference of 0.36%), Immigrants from Kenya ($53,427, a difference of 0.41%), and Immigrants from Costa Rica ($53,237, a difference of 0.77%). Similarly, the demographic groups most similar to Native Hawaiians are Cajun ($52,325, a difference of 0.040%), Delaware ($52,412, a difference of 0.20%), Tlingit-Haida ($52,409, a difference of 0.20%), Bermudan ($52,465, a difference of 0.30%), and Venezuelan ($52,510, a difference of 0.39%).
| Demographics | Rating | Rank | Median Male Earnings |
| Kenyans | 30.4 /100 | #193 | Fair $53,647 |
| Spanish | 29.0 /100 | #194 | Fair $53,576 |
| Immigrants | Azores | 27.5 /100 | #195 | Fair $53,503 |
| Immigrants | Africa | 26.6 /100 | #196 | Fair $53,457 |
| Immigrants | Kenya | 26.0 /100 | #197 | Fair $53,427 |
| Immigrants | Costa Rica | 22.6 /100 | #198 | Fair $53,237 |
| Tongans | 22.3 /100 | #199 | Fair $53,218 |
| Immigrants | Thailand | 17.5 /100 | #200 | Poor $52,908 |
| Immigrants | Bosnia and Herzegovina | 16.9 /100 | #201 | Poor $52,869 |
| Immigrants | Uruguay | 16.8 /100 | #202 | Poor $52,860 |
| Panamanians | 16.5 /100 | #203 | Poor $52,835 |
| Ghanaians | 16.1 /100 | #204 | Poor $52,810 |
| Immigrants | Colombia | 15.0 /100 | #205 | Poor $52,725 |
| Immigrants | Iraq | 14.5 /100 | #206 | Poor $52,681 |
| Vietnamese | 12.7 /100 | #207 | Poor $52,525 |
| Venezuelans | 12.5 /100 | #208 | Poor $52,510 |
| Bermudans | 12.1 /100 | #209 | Poor $52,465 |
| Delaware | 11.5 /100 | #210 | Poor $52,412 |
| Tlingit-Haida | 11.5 /100 | #211 | Poor $52,409 |
| Cajuns | 10.7 /100 | #212 | Poor $52,325 |
| Native Hawaiians | 10.5 /100 | #213 | Poor $52,306 |