Kenyan vs Romanian Ambulatory Disability
COMPARE
Kenyan
Romanian
Ambulatory Disability
Ambulatory Disability Comparison
Kenyans
Romanians
5.8%
AMBULATORY DISABILITY
98.4/ 100
METRIC RATING
94th/ 347
METRIC RANK
6.0%
AMBULATORY DISABILITY
82.9/ 100
METRIC RATING
143rd/ 347
METRIC RANK
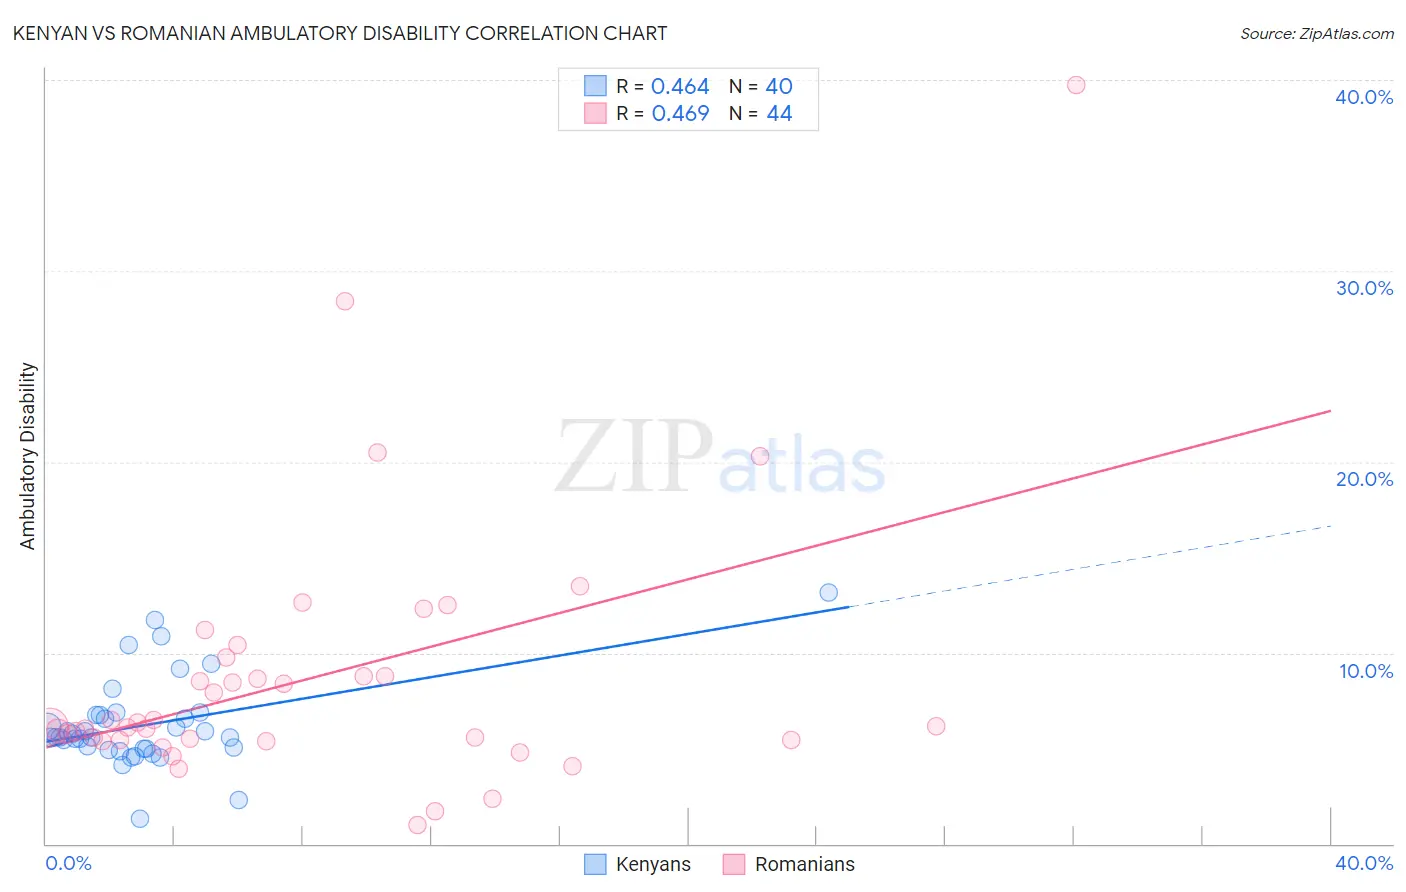
Kenyan vs Romanian Ambulatory Disability Correlation Chart
The statistical analysis conducted on geographies consisting of 168,175,436 people shows a moderate positive correlation between the proportion of Kenyans and percentage of population with ambulatory disability in the United States with a correlation coefficient (R) of 0.464 and weighted average of 5.8%. Similarly, the statistical analysis conducted on geographies consisting of 377,793,215 people shows a moderate positive correlation between the proportion of Romanians and percentage of population with ambulatory disability in the United States with a correlation coefficient (R) of 0.469 and weighted average of 6.0%, a difference of 3.6%.
Ambulatory Disability Correlation Summary
| Measurement | Kenyan | Romanian |
| Minimum | 1.3% | 1.00% |
| Maximum | 13.2% | 39.7% |
| Range | 11.9% | 38.7% |
| Mean | 6.2% | 8.7% |
| Median | 5.6% | 6.2% |
| Interquartile 25% (IQ1) | 5.0% | 5.4% |
| Interquartile 75% (IQ3) | 6.8% | 9.3% |
| Interquartile Range (IQR) | 1.8% | 3.8% |
| Standard Deviation (Sample) | 2.3% | 7.0% |
| Standard Deviation (Population) | 2.3% | 6.9% |
Similar Demographics by Ambulatory Disability
Demographics Similar to Kenyans by Ambulatory Disability
In terms of ambulatory disability, the demographic groups most similar to Kenyans are Immigrants from El Salvador (5.8%, a difference of 0.040%), Salvadoran (5.8%, a difference of 0.060%), Immigrants from Somalia (5.8%, a difference of 0.10%), Immigrants from Lebanon (5.8%, a difference of 0.12%), and Immigrants from Denmark (5.8%, a difference of 0.19%).
| Demographics | Rating | Rank | Ambulatory Disability |
| Immigrants | Chile | 98.9 /100 | #87 | Exceptional 5.8% |
| Soviet Union | 98.9 /100 | #88 | Exceptional 5.8% |
| Bhutanese | 98.8 /100 | #89 | Exceptional 5.8% |
| Australians | 98.8 /100 | #90 | Exceptional 5.8% |
| Immigrants | Sudan | 98.8 /100 | #91 | Exceptional 5.8% |
| Immigrants | Sierra Leone | 98.6 /100 | #92 | Exceptional 5.8% |
| Immigrants | Denmark | 98.6 /100 | #93 | Exceptional 5.8% |
| Kenyans | 98.4 /100 | #94 | Exceptional 5.8% |
| Immigrants | El Salvador | 98.4 /100 | #95 | Exceptional 5.8% |
| Salvadorans | 98.4 /100 | #96 | Exceptional 5.8% |
| Immigrants | Somalia | 98.3 /100 | #97 | Exceptional 5.8% |
| Immigrants | Lebanon | 98.3 /100 | #98 | Exceptional 5.8% |
| Immigrants | Northern Europe | 98.2 /100 | #99 | Exceptional 5.8% |
| Immigrants | Serbia | 97.9 /100 | #100 | Exceptional 5.8% |
| Immigrants | South America | 97.9 /100 | #101 | Exceptional 5.8% |
Demographics Similar to Romanians by Ambulatory Disability
In terms of ambulatory disability, the demographic groups most similar to Romanians are Immigrants from Philippines (6.0%, a difference of 0.010%), Macedonian (6.0%, a difference of 0.010%), Swedish (6.0%, a difference of 0.020%), Czech (6.0%, a difference of 0.040%), and Pakistani (6.0%, a difference of 0.040%).
| Demographics | Rating | Rank | Ambulatory Disability |
| Immigrants | North Macedonia | 84.1 /100 | #136 | Excellent 6.0% |
| Immigrants | Syria | 84.1 /100 | #137 | Excellent 6.0% |
| Immigrants | Hungary | 83.9 /100 | #138 | Excellent 6.0% |
| Immigrants | Zaire | 83.6 /100 | #139 | Excellent 6.0% |
| Czechs | 83.3 /100 | #140 | Excellent 6.0% |
| Swedes | 83.1 /100 | #141 | Excellent 6.0% |
| Immigrants | Philippines | 83.0 /100 | #142 | Excellent 6.0% |
| Romanians | 82.9 /100 | #143 | Excellent 6.0% |
| Macedonians | 82.8 /100 | #144 | Excellent 6.0% |
| Pakistanis | 82.5 /100 | #145 | Excellent 6.0% |
| Immigrants | Greece | 82.5 /100 | #146 | Excellent 6.0% |
| Immigrants | Moldova | 82.4 /100 | #147 | Excellent 6.0% |
| Immigrants | Eastern Europe | 82.0 /100 | #148 | Excellent 6.0% |
| Lithuanians | 81.9 /100 | #149 | Excellent 6.0% |
| Maltese | 81.6 /100 | #150 | Excellent 6.0% |