Jordanian vs Slavic Single Mother Households
COMPARE
Jordanian
Slavic
Single Mother Households
Single Mother Households Comparison
Jordanians
Slavs
6.0%
SINGLE MOTHER HOUSEHOLDS
88.9/ 100
METRIC RATING
136th/ 347
METRIC RANK
5.9%
SINGLE MOTHER HOUSEHOLDS
92.9/ 100
METRIC RATING
125th/ 347
METRIC RANK
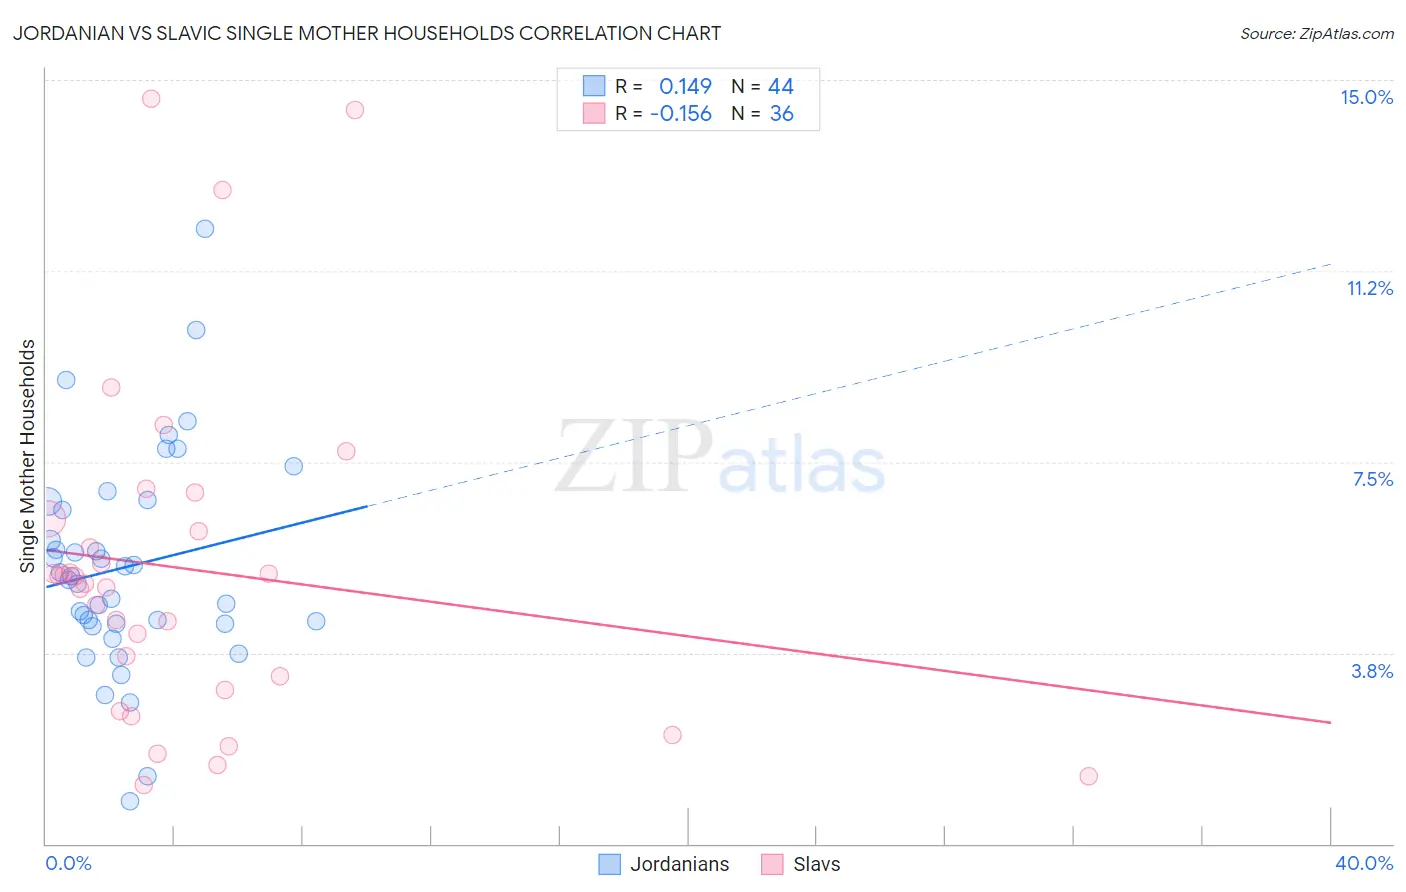
Jordanian vs Slavic Single Mother Households Correlation Chart
The statistical analysis conducted on geographies consisting of 166,276,124 people shows a poor positive correlation between the proportion of Jordanians and percentage of single mother households in the United States with a correlation coefficient (R) of 0.149 and weighted average of 6.0%. Similarly, the statistical analysis conducted on geographies consisting of 270,240,357 people shows a poor negative correlation between the proportion of Slavs and percentage of single mother households in the United States with a correlation coefficient (R) of -0.156 and weighted average of 5.9%, a difference of 1.5%.
Single Mother Households Correlation Summary
| Measurement | Jordanian | Slavic |
| Minimum | 0.84% | 1.2% |
| Maximum | 12.1% | 14.6% |
| Range | 11.2% | 13.5% |
| Mean | 5.4% | 5.4% |
| Median | 5.2% | 5.2% |
| Interquartile 25% (IQ1) | 4.3% | 3.1% |
| Interquartile 75% (IQ3) | 6.6% | 6.3% |
| Interquartile Range (IQR) | 2.3% | 3.1% |
| Standard Deviation (Sample) | 2.1% | 3.3% |
| Standard Deviation (Population) | 2.1% | 3.2% |
Demographics Similar to Jordanians and Slavs by Single Mother Households
In terms of single mother households, the demographic groups most similar to Jordanians are Immigrants from Pakistan (6.0%, a difference of 0.13%), Immigrants from Saudi Arabia (5.9%, a difference of 0.42%), Canadian (5.9%, a difference of 0.51%), Icelander (6.0%, a difference of 0.53%), and Egyptian (5.9%, a difference of 0.57%). Similarly, the demographic groups most similar to Slavs are Welsh (5.9%, a difference of 0.020%), Immigrants from Argentina (5.9%, a difference of 0.16%), Lebanese (5.9%, a difference of 0.21%), Immigrants from Uzbekistan (5.9%, a difference of 0.23%), and Belgian (5.8%, a difference of 0.29%).
| Demographics | Rating | Rank | Single Mother Households |
| Tongans | 93.7 /100 | #120 | Exceptional 5.8% |
| Argentineans | 93.7 /100 | #121 | Exceptional 5.8% |
| Belgians | 93.5 /100 | #122 | Exceptional 5.8% |
| Immigrants | Uzbekistan | 93.4 /100 | #123 | Exceptional 5.9% |
| Immigrants | Argentina | 93.2 /100 | #124 | Exceptional 5.9% |
| Slavs | 92.9 /100 | #125 | Exceptional 5.9% |
| Welsh | 92.8 /100 | #126 | Exceptional 5.9% |
| Lebanese | 92.4 /100 | #127 | Exceptional 5.9% |
| Czechoslovakians | 92.2 /100 | #128 | Exceptional 5.9% |
| Immigrants | Bolivia | 92.2 /100 | #129 | Exceptional 5.9% |
| Palestinians | 92.1 /100 | #130 | Exceptional 5.9% |
| Immigrants | Spain | 91.2 /100 | #131 | Exceptional 5.9% |
| Albanians | 91.1 /100 | #132 | Exceptional 5.9% |
| Egyptians | 90.7 /100 | #133 | Exceptional 5.9% |
| Canadians | 90.5 /100 | #134 | Exceptional 5.9% |
| Immigrants | Saudi Arabia | 90.2 /100 | #135 | Exceptional 5.9% |
| Jordanians | 88.9 /100 | #136 | Excellent 6.0% |
| Immigrants | Pakistan | 88.4 /100 | #137 | Excellent 6.0% |
| Icelanders | 86.9 /100 | #138 | Excellent 6.0% |
| Syrians | 86.0 /100 | #139 | Excellent 6.0% |
| French | 85.7 /100 | #140 | Excellent 6.0% |