Jordanian vs Slavic 3rd Grade
COMPARE
Jordanian
Slavic
3rd Grade
3rd Grade Comparison
Jordanians
Slavs
97.8%
3RD GRADE
74.5/ 100
METRIC RATING
150th/ 347
METRIC RANK
98.3%
3RD GRADE
99.7/ 100
METRIC RATING
57th/ 347
METRIC RANK
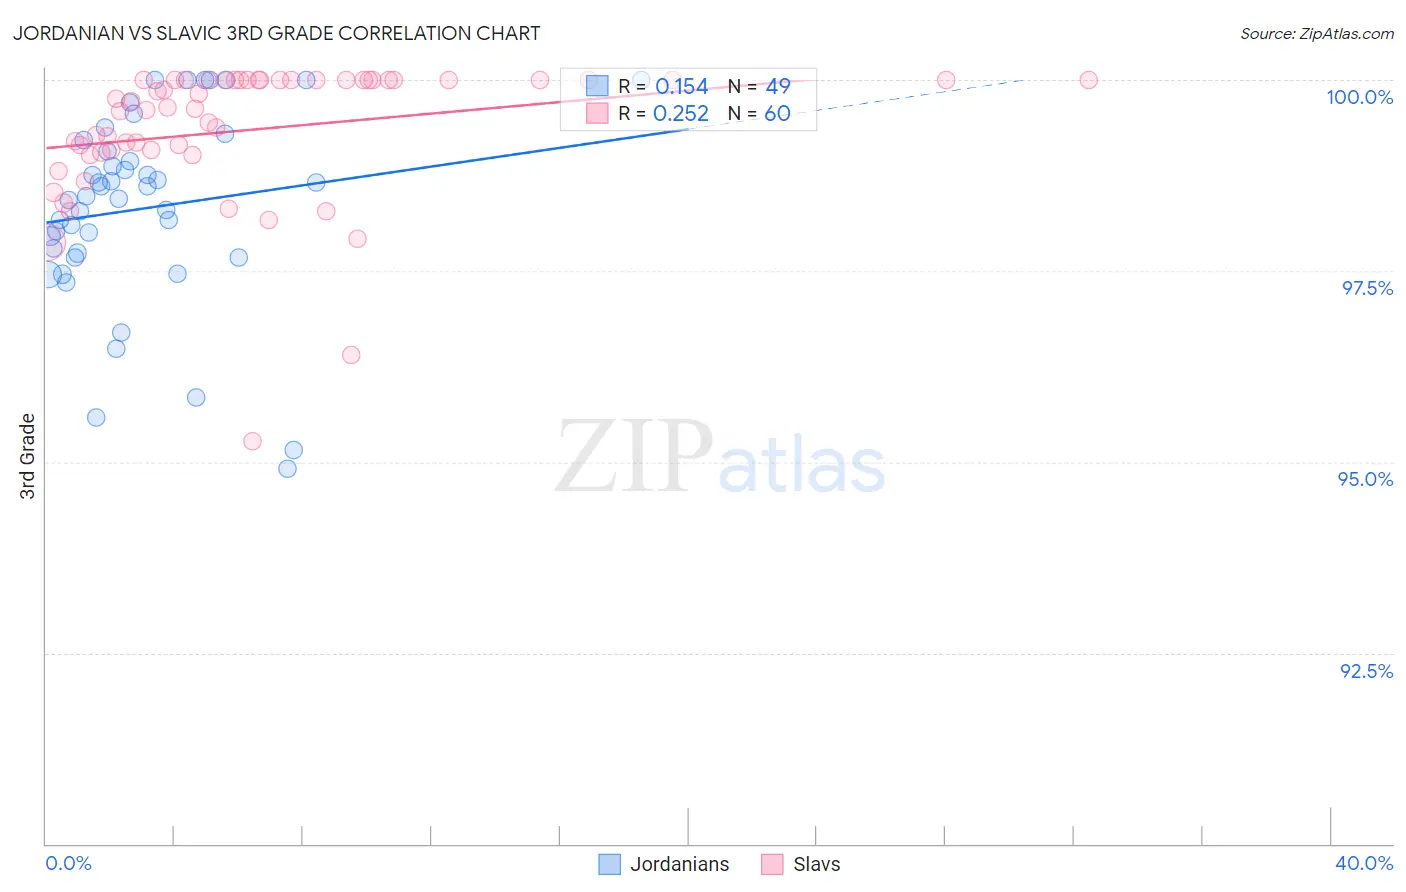
Jordanian vs Slavic 3rd Grade Correlation Chart
The statistical analysis conducted on geographies consisting of 166,424,117 people shows a poor positive correlation between the proportion of Jordanians and percentage of population with at least 3rd grade education in the United States with a correlation coefficient (R) of 0.154 and weighted average of 97.8%. Similarly, the statistical analysis conducted on geographies consisting of 270,869,056 people shows a weak positive correlation between the proportion of Slavs and percentage of population with at least 3rd grade education in the United States with a correlation coefficient (R) of 0.252 and weighted average of 98.3%, a difference of 0.41%.
3rd Grade Correlation Summary
| Measurement | Jordanian | Slavic |
| Minimum | 94.9% | 95.3% |
| Maximum | 100.0% | 100.0% |
| Range | 5.1% | 4.7% |
| Mean | 98.3% | 99.3% |
| Median | 98.5% | 99.7% |
| Interquartile 25% (IQ1) | 97.7% | 99.1% |
| Interquartile 75% (IQ3) | 99.1% | 100.0% |
| Interquartile Range (IQR) | 1.4% | 0.93% |
| Standard Deviation (Sample) | 1.3% | 0.91% |
| Standard Deviation (Population) | 1.2% | 0.91% |
Similar Demographics by 3rd Grade
Demographics Similar to Jordanians by 3rd Grade
In terms of 3rd grade, the demographic groups most similar to Jordanians are Immigrants from North Macedonia (97.8%, a difference of 0.0%), Immigrants from Israel (97.9%, a difference of 0.010%), Immigrants from Moldova (97.9%, a difference of 0.010%), Soviet Union (97.8%, a difference of 0.010%), and Burmese (97.9%, a difference of 0.020%).
| Demographics | Rating | Rank | 3rd Grade |
| Filipinos | 79.9 /100 | #143 | Good 97.9% |
| Burmese | 79.6 /100 | #144 | Good 97.9% |
| Immigrants | Greece | 79.5 /100 | #145 | Good 97.9% |
| Alsatians | 78.3 /100 | #146 | Good 97.9% |
| Immigrants | Israel | 77.3 /100 | #147 | Good 97.9% |
| Immigrants | Moldova | 77.1 /100 | #148 | Good 97.9% |
| Immigrants | North Macedonia | 74.5 /100 | #149 | Good 97.8% |
| Jordanians | 74.5 /100 | #150 | Good 97.8% |
| Soviet Union | 72.6 /100 | #151 | Good 97.8% |
| Immigrants | South Central Asia | 69.5 /100 | #152 | Good 97.8% |
| Apache | 68.5 /100 | #153 | Good 97.8% |
| Immigrants | Eastern Europe | 64.1 /100 | #154 | Good 97.8% |
| Bermudans | 62.6 /100 | #155 | Good 97.8% |
| Immigrants | Russia | 61.7 /100 | #156 | Good 97.8% |
| Immigrants | Italy | 61.2 /100 | #157 | Good 97.8% |
Demographics Similar to Slavs by 3rd Grade
In terms of 3rd grade, the demographic groups most similar to Slavs are American (98.3%, a difference of 0.0%), Austrian (98.3%, a difference of 0.0%), Greek (98.3%, a difference of 0.0%), Maltese (98.3%, a difference of 0.0%), and Creek (98.2%, a difference of 0.0%).
| Demographics | Rating | Rank | 3rd Grade |
| Celtics | 99.8 /100 | #50 | Exceptional 98.3% |
| Australians | 99.8 /100 | #51 | Exceptional 98.3% |
| Whites/Caucasians | 99.8 /100 | #52 | Exceptional 98.3% |
| Immigrants | Scotland | 99.8 /100 | #53 | Exceptional 98.3% |
| Bulgarians | 99.8 /100 | #54 | Exceptional 98.3% |
| Americans | 99.8 /100 | #55 | Exceptional 98.3% |
| Austrians | 99.8 /100 | #56 | Exceptional 98.3% |
| Slavs | 99.7 /100 | #57 | Exceptional 98.3% |
| Greeks | 99.7 /100 | #58 | Exceptional 98.3% |
| Maltese | 99.7 /100 | #59 | Exceptional 98.3% |
| Creek | 99.7 /100 | #60 | Exceptional 98.2% |
| Pueblo | 99.7 /100 | #61 | Exceptional 98.2% |
| Immigrants | Canada | 99.7 /100 | #62 | Exceptional 98.2% |
| Immigrants | North America | 99.7 /100 | #63 | Exceptional 98.2% |
| Kiowa | 99.6 /100 | #64 | Exceptional 98.2% |