Macedonian vs Immigrants from Lithuania Median Household Income
COMPARE
Macedonian
Immigrants from Lithuania
Median Household Income
Median Household Income Comparison
Macedonians
Immigrants from Lithuania
$90,761
MEDIAN HOUSEHOLD INCOME
97.4/ 100
METRIC RATING
106th/ 347
METRIC RANK
$96,836
MEDIAN HOUSEHOLD INCOME
99.9/ 100
METRIC RATING
42nd/ 347
METRIC RANK
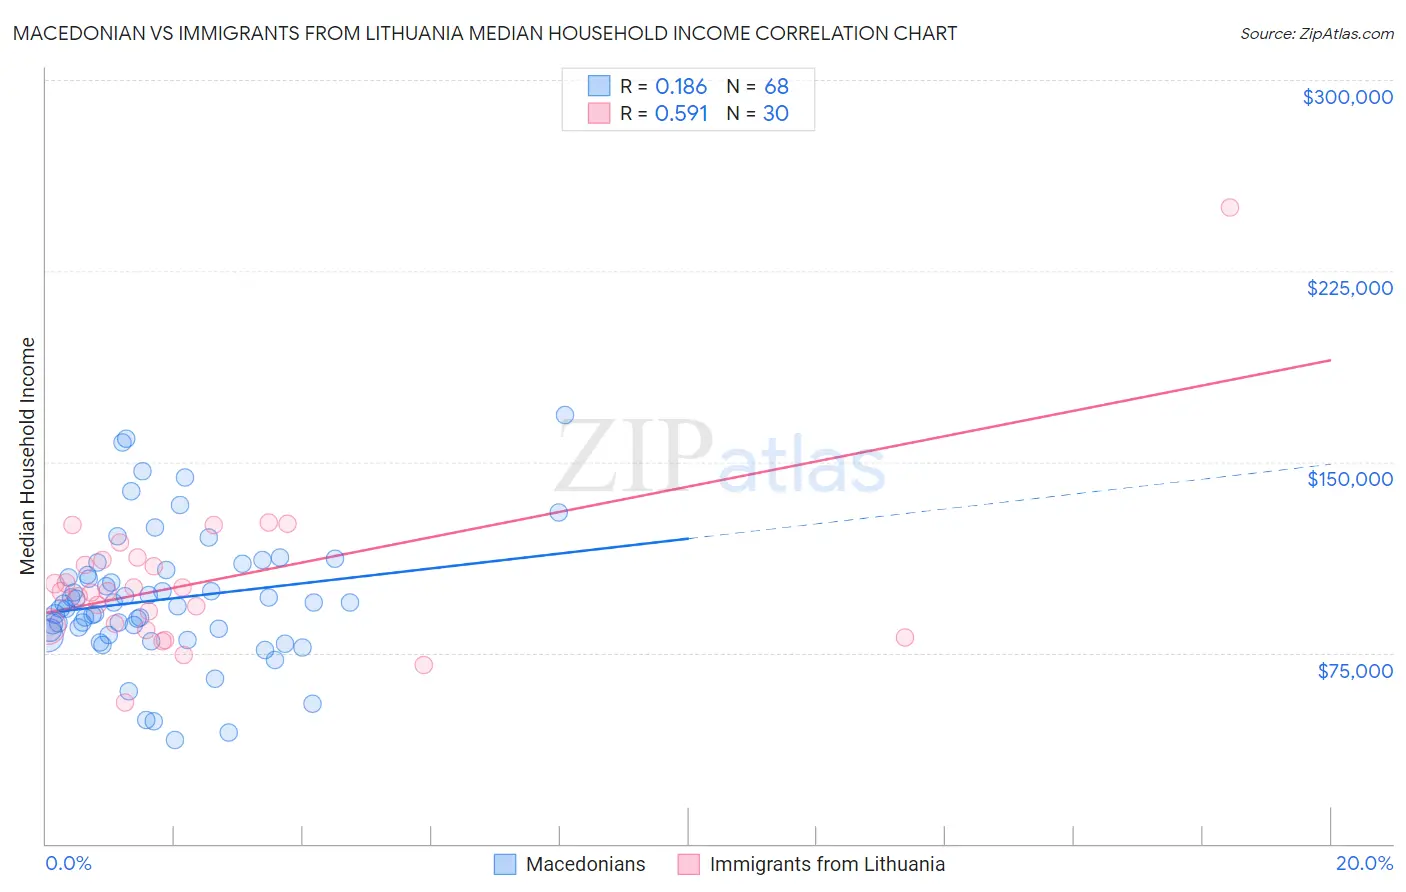
Macedonian vs Immigrants from Lithuania Median Household Income Correlation Chart
The statistical analysis conducted on geographies consisting of 132,580,342 people shows a poor positive correlation between the proportion of Macedonians and median household income in the United States with a correlation coefficient (R) of 0.186 and weighted average of $90,761. Similarly, the statistical analysis conducted on geographies consisting of 117,713,976 people shows a substantial positive correlation between the proportion of Immigrants from Lithuania and median household income in the United States with a correlation coefficient (R) of 0.591 and weighted average of $96,836, a difference of 6.7%.
Median Household Income Correlation Summary
| Measurement | Macedonian | Immigrants from Lithuania |
| Minimum | $40,833 | $55,636 |
| Maximum | $168,448 | $250,001 |
| Range | $127,615 | $194,365 |
| Mean | $96,021 | $102,979 |
| Median | $93,863 | $99,018 |
| Interquartile 25% (IQ1) | $83,085 | $85,668 |
| Interquartile 75% (IQ3) | $106,377 | $111,586 |
| Interquartile Range (IQR) | $23,292 | $25,918 |
| Standard Deviation (Sample) | $25,740 | $32,780 |
| Standard Deviation (Population) | $25,550 | $32,229 |
Similar Demographics by Median Household Income
Demographics Similar to Macedonians by Median Household Income
In terms of median household income, the demographic groups most similar to Macedonians are Croatian ($90,685, a difference of 0.080%), Immigrants from Brazil ($90,907, a difference of 0.16%), Zimbabwean ($90,618, a difference of 0.16%), Chilean ($90,605, a difference of 0.17%), and Palestinian ($90,574, a difference of 0.21%).
| Demographics | Rating | Rank | Median Household Income |
| Immigrants | South Eastern Asia | 98.4 /100 | #99 | Exceptional $91,541 |
| Ukrainians | 98.3 /100 | #100 | Exceptional $91,456 |
| Immigrants | Moldova | 98.3 /100 | #101 | Exceptional $91,446 |
| Austrians | 98.2 /100 | #102 | Exceptional $91,339 |
| Immigrants | Ukraine | 98.0 /100 | #103 | Exceptional $91,124 |
| Immigrants | Kazakhstan | 97.8 /100 | #104 | Exceptional $91,015 |
| Immigrants | Brazil | 97.7 /100 | #105 | Exceptional $90,907 |
| Macedonians | 97.4 /100 | #106 | Exceptional $90,761 |
| Croatians | 97.3 /100 | #107 | Exceptional $90,685 |
| Zimbabweans | 97.2 /100 | #108 | Exceptional $90,618 |
| Chileans | 97.2 /100 | #109 | Exceptional $90,605 |
| Palestinians | 97.1 /100 | #110 | Exceptional $90,574 |
| Immigrants | Poland | 97.1 /100 | #111 | Exceptional $90,549 |
| Northern Europeans | 96.9 /100 | #112 | Exceptional $90,446 |
| Peruvians | 96.5 /100 | #113 | Exceptional $90,261 |
Demographics Similar to Immigrants from Lithuania by Median Household Income
In terms of median household income, the demographic groups most similar to Immigrants from Lithuania are Immigrants from France ($96,743, a difference of 0.10%), Immigrants from Turkey ($96,964, a difference of 0.13%), Immigrants from Greece ($96,675, a difference of 0.17%), Maltese ($97,015, a difference of 0.18%), and Afghan ($97,026, a difference of 0.20%).
| Demographics | Rating | Rank | Median Household Income |
| Immigrants | Switzerland | 100.0 /100 | #35 | Exceptional $97,979 |
| Immigrants | Pakistan | 100.0 /100 | #36 | Exceptional $97,528 |
| Latvians | 100.0 /100 | #37 | Exceptional $97,311 |
| Immigrants | Indonesia | 100.0 /100 | #38 | Exceptional $97,297 |
| Afghans | 100.0 /100 | #39 | Exceptional $97,026 |
| Maltese | 100.0 /100 | #40 | Exceptional $97,015 |
| Immigrants | Turkey | 100.0 /100 | #41 | Exceptional $96,964 |
| Immigrants | Lithuania | 99.9 /100 | #42 | Exceptional $96,836 |
| Immigrants | France | 99.9 /100 | #43 | Exceptional $96,743 |
| Immigrants | Greece | 99.9 /100 | #44 | Exceptional $96,675 |
| Israelis | 99.9 /100 | #45 | Exceptional $96,552 |
| Australians | 99.9 /100 | #46 | Exceptional $96,490 |
| Immigrants | Russia | 99.9 /100 | #47 | Exceptional $96,378 |
| Cambodians | 99.9 /100 | #48 | Exceptional $96,324 |
| Immigrants | Malaysia | 99.9 /100 | #49 | Exceptional $96,292 |