Jordanian vs Immigrants from Lithuania 3rd Grade
COMPARE
Jordanian
Immigrants from Lithuania
3rd Grade
3rd Grade Comparison
Jordanians
Immigrants from Lithuania
97.8%
3RD GRADE
74.5/ 100
METRIC RATING
150th/ 347
METRIC RANK
98.2%
3RD GRADE
99.2/ 100
METRIC RATING
77th/ 347
METRIC RANK
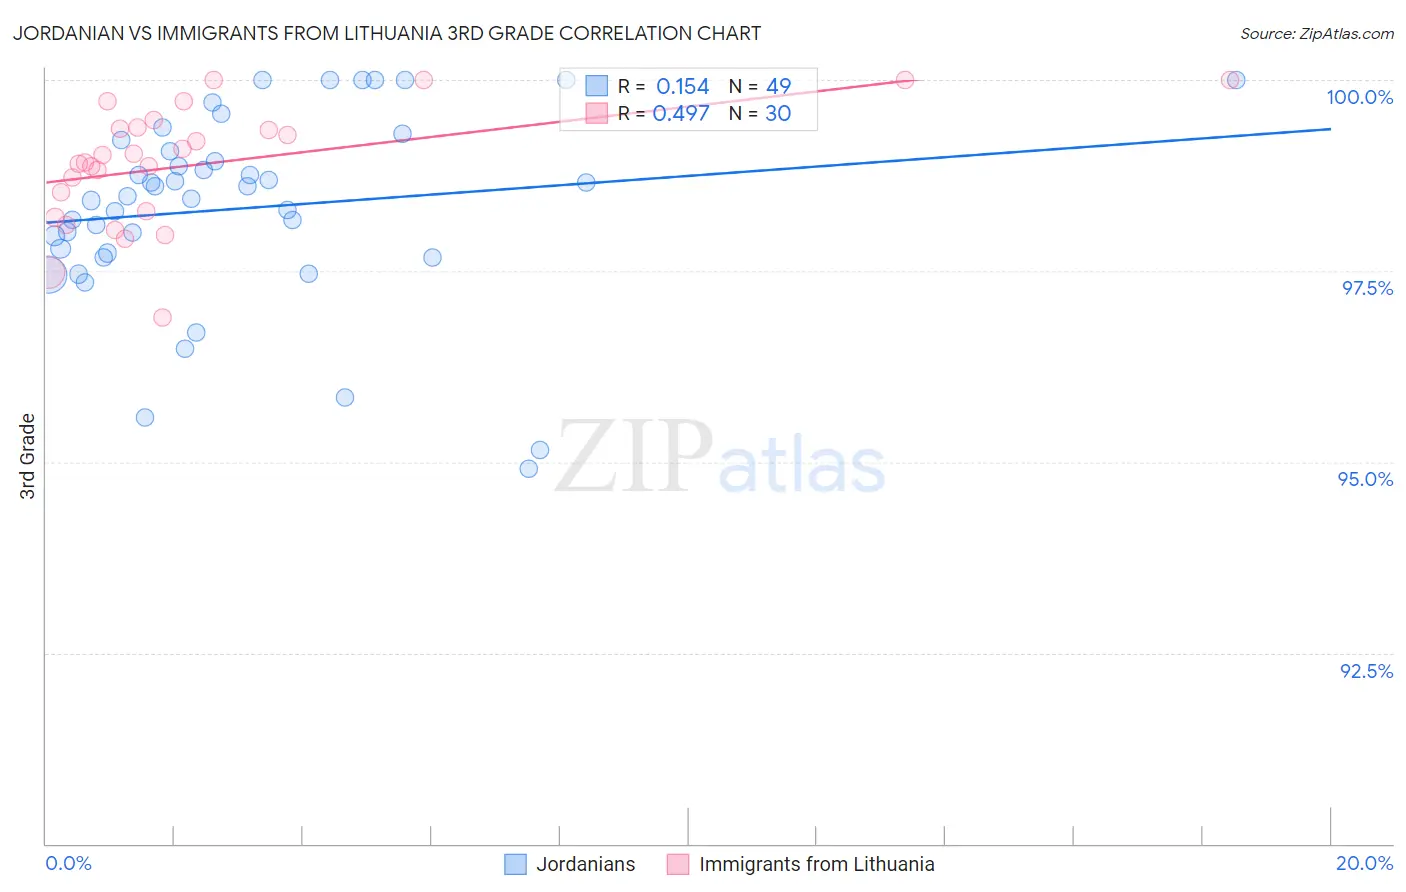
Jordanian vs Immigrants from Lithuania 3rd Grade Correlation Chart
The statistical analysis conducted on geographies consisting of 166,424,117 people shows a poor positive correlation between the proportion of Jordanians and percentage of population with at least 3rd grade education in the United States with a correlation coefficient (R) of 0.154 and weighted average of 97.8%. Similarly, the statistical analysis conducted on geographies consisting of 117,724,932 people shows a moderate positive correlation between the proportion of Immigrants from Lithuania and percentage of population with at least 3rd grade education in the United States with a correlation coefficient (R) of 0.497 and weighted average of 98.2%, a difference of 0.32%.
3rd Grade Correlation Summary
| Measurement | Jordanian | Immigrants from Lithuania |
| Minimum | 94.9% | 96.9% |
| Maximum | 100.0% | 100.0% |
| Range | 5.1% | 3.1% |
| Mean | 98.3% | 98.9% |
| Median | 98.5% | 99.0% |
| Interquartile 25% (IQ1) | 97.7% | 98.3% |
| Interquartile 75% (IQ3) | 99.1% | 99.4% |
| Interquartile Range (IQR) | 1.4% | 1.1% |
| Standard Deviation (Sample) | 1.3% | 0.78% |
| Standard Deviation (Population) | 1.2% | 0.77% |
Similar Demographics by 3rd Grade
Demographics Similar to Jordanians by 3rd Grade
In terms of 3rd grade, the demographic groups most similar to Jordanians are Immigrants from North Macedonia (97.8%, a difference of 0.0%), Immigrants from Israel (97.9%, a difference of 0.010%), Immigrants from Moldova (97.9%, a difference of 0.010%), Soviet Union (97.8%, a difference of 0.010%), and Burmese (97.9%, a difference of 0.020%).
| Demographics | Rating | Rank | 3rd Grade |
| Filipinos | 79.9 /100 | #143 | Good 97.9% |
| Burmese | 79.6 /100 | #144 | Good 97.9% |
| Immigrants | Greece | 79.5 /100 | #145 | Good 97.9% |
| Alsatians | 78.3 /100 | #146 | Good 97.9% |
| Immigrants | Israel | 77.3 /100 | #147 | Good 97.9% |
| Immigrants | Moldova | 77.1 /100 | #148 | Good 97.9% |
| Immigrants | North Macedonia | 74.5 /100 | #149 | Good 97.8% |
| Jordanians | 74.5 /100 | #150 | Good 97.8% |
| Soviet Union | 72.6 /100 | #151 | Good 97.8% |
| Immigrants | South Central Asia | 69.5 /100 | #152 | Good 97.8% |
| Apache | 68.5 /100 | #153 | Good 97.8% |
| Immigrants | Eastern Europe | 64.1 /100 | #154 | Good 97.8% |
| Bermudans | 62.6 /100 | #155 | Good 97.8% |
| Immigrants | Russia | 61.7 /100 | #156 | Good 97.8% |
| Immigrants | Italy | 61.2 /100 | #157 | Good 97.8% |
Demographics Similar to Immigrants from Lithuania by 3rd Grade
In terms of 3rd grade, the demographic groups most similar to Immigrants from Lithuania are Immigrants from England (98.2%, a difference of 0.0%), Immigrants from Netherlands (98.2%, a difference of 0.010%), Cherokee (98.2%, a difference of 0.010%), Osage (98.2%, a difference of 0.010%), and Immigrants from Belgium (98.1%, a difference of 0.010%).
| Demographics | Rating | Rank | 3rd Grade |
| Cajuns | 99.6 /100 | #70 | Exceptional 98.2% |
| Immigrants | Austria | 99.6 /100 | #71 | Exceptional 98.2% |
| Chickasaw | 99.5 /100 | #72 | Exceptional 98.2% |
| Cheyenne | 99.3 /100 | #73 | Exceptional 98.2% |
| Immigrants | Netherlands | 99.3 /100 | #74 | Exceptional 98.2% |
| Cherokee | 99.3 /100 | #75 | Exceptional 98.2% |
| Immigrants | England | 99.2 /100 | #76 | Exceptional 98.2% |
| Immigrants | Lithuania | 99.2 /100 | #77 | Exceptional 98.2% |
| Osage | 99.2 /100 | #78 | Exceptional 98.2% |
| Immigrants | Belgium | 99.1 /100 | #79 | Exceptional 98.1% |
| Macedonians | 99.1 /100 | #80 | Exceptional 98.1% |
| Icelanders | 99.1 /100 | #81 | Exceptional 98.1% |
| Shoshone | 99.0 /100 | #82 | Exceptional 98.1% |
| Ukrainians | 98.9 /100 | #83 | Exceptional 98.1% |
| Immigrants | Sweden | 98.9 /100 | #84 | Exceptional 98.1% |