Immigrants from Eastern Europe vs Samoan Median Family Income
COMPARE
Immigrants from Eastern Europe
Samoan
Median Family Income
Median Family Income Comparison
Immigrants from Eastern Europe
Samoans
$112,527
MEDIAN FAMILY INCOME
99.4/ 100
METRIC RATING
77th/ 347
METRIC RANK
$100,344
MEDIAN FAMILY INCOME
23.3/ 100
METRIC RATING
196th/ 347
METRIC RANK
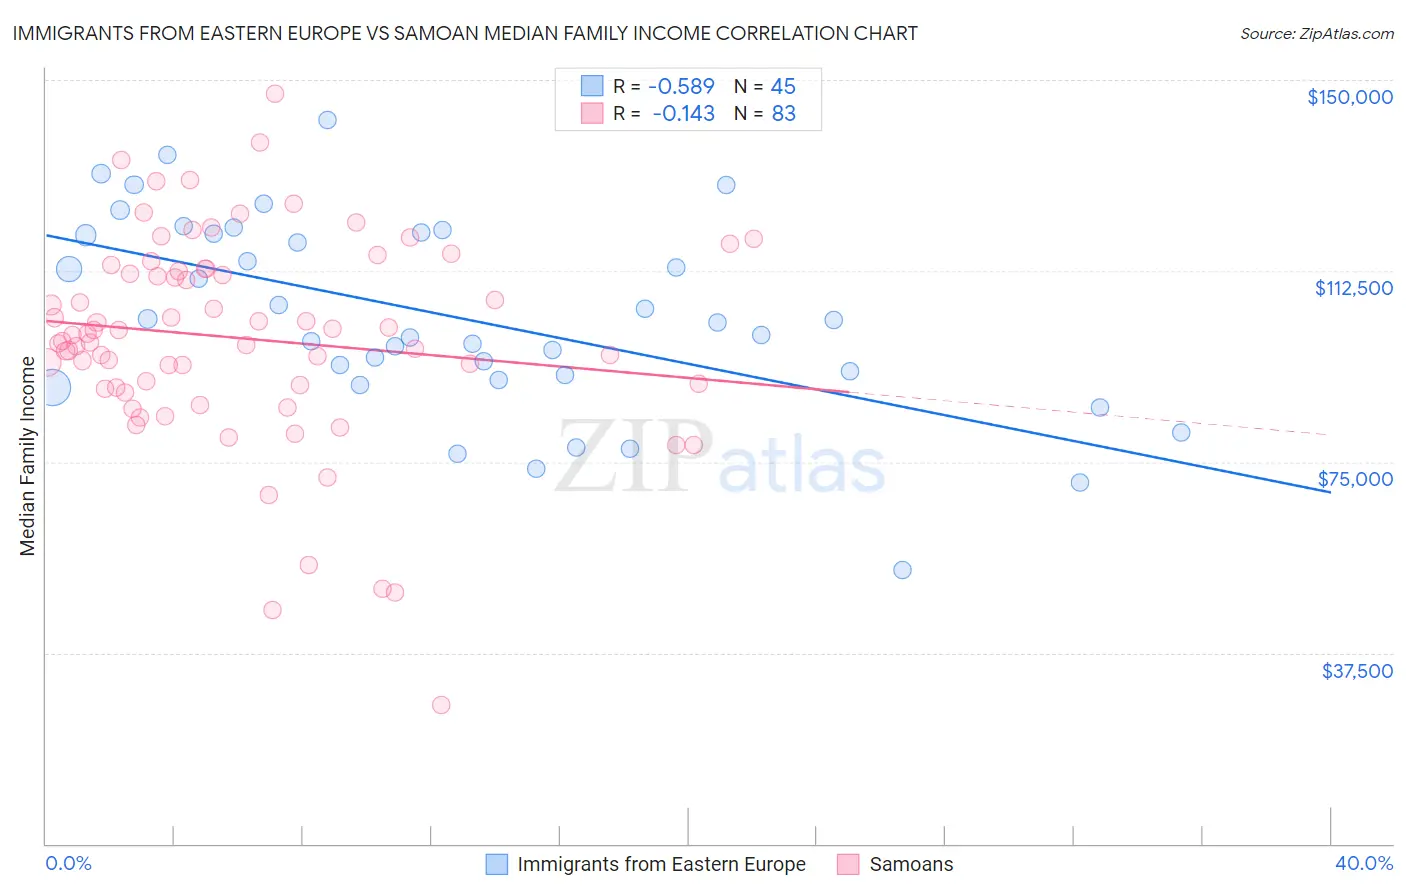
Immigrants from Eastern Europe vs Samoan Median Family Income Correlation Chart
The statistical analysis conducted on geographies consisting of 475,294,506 people shows a substantial negative correlation between the proportion of Immigrants from Eastern Europe and median family income in the United States with a correlation coefficient (R) of -0.589 and weighted average of $112,527. Similarly, the statistical analysis conducted on geographies consisting of 225,048,976 people shows a poor negative correlation between the proportion of Samoans and median family income in the United States with a correlation coefficient (R) of -0.143 and weighted average of $100,344, a difference of 12.1%.
Median Family Income Correlation Summary
| Measurement | Immigrants from Eastern Europe | Samoan |
| Minimum | $53,863 | $27,294 |
| Maximum | $142,041 | $147,200 |
| Range | $88,178 | $119,906 |
| Mean | $103,481 | $99,252 |
| Median | $102,281 | $99,920 |
| Interquartile 25% (IQ1) | $91,657 | $89,665 |
| Interquartile 75% (IQ3) | $119,896 | $112,813 |
| Interquartile Range (IQR) | $28,238 | $23,148 |
| Standard Deviation (Sample) | $19,233 | $20,629 |
| Standard Deviation (Population) | $19,018 | $20,504 |
Similar Demographics by Median Family Income
Demographics Similar to Immigrants from Eastern Europe by Median Family Income
In terms of median family income, the demographic groups most similar to Immigrants from Eastern Europe are Argentinean ($112,665, a difference of 0.12%), Immigrants from Western Europe ($112,688, a difference of 0.14%), Immigrants from Canada ($112,374, a difference of 0.14%), Italian ($112,372, a difference of 0.14%), and Immigrants from Croatia ($112,323, a difference of 0.18%).
| Demographics | Rating | Rank | Median Family Income |
| Immigrants | Romania | 99.6 /100 | #70 | Exceptional $113,434 |
| South Africans | 99.5 /100 | #71 | Exceptional $113,229 |
| Afghans | 99.5 /100 | #72 | Exceptional $112,971 |
| Laotians | 99.5 /100 | #73 | Exceptional $112,859 |
| Immigrants | Italy | 99.4 /100 | #74 | Exceptional $112,848 |
| Immigrants | Western Europe | 99.4 /100 | #75 | Exceptional $112,688 |
| Argentineans | 99.4 /100 | #76 | Exceptional $112,665 |
| Immigrants | Eastern Europe | 99.4 /100 | #77 | Exceptional $112,527 |
| Immigrants | Canada | 99.3 /100 | #78 | Exceptional $112,374 |
| Italians | 99.3 /100 | #79 | Exceptional $112,372 |
| Immigrants | Croatia | 99.3 /100 | #80 | Exceptional $112,323 |
| Immigrants | North America | 99.2 /100 | #81 | Exceptional $112,151 |
| Immigrants | England | 99.2 /100 | #82 | Exceptional $112,038 |
| Immigrants | Egypt | 99.0 /100 | #83 | Exceptional $111,689 |
| Immigrants | Hungary | 98.8 /100 | #84 | Exceptional $111,378 |
Demographics Similar to Samoans by Median Family Income
In terms of median family income, the demographic groups most similar to Samoans are Immigrants from Cameroon ($100,289, a difference of 0.060%), Immigrants from South America ($100,414, a difference of 0.070%), Immigrants from Africa ($100,256, a difference of 0.090%), Yugoslavian ($100,119, a difference of 0.22%), and Iraqi ($100,658, a difference of 0.31%).
| Demographics | Rating | Rank | Median Family Income |
| Immigrants | Portugal | 29.6 /100 | #189 | Fair $100,984 |
| Immigrants | Immigrants | 29.4 /100 | #190 | Fair $100,962 |
| Colombians | 27.2 /100 | #191 | Fair $100,750 |
| Immigrants | Kenya | 26.5 /100 | #192 | Fair $100,679 |
| Iraqis | 26.3 /100 | #193 | Fair $100,658 |
| Uruguayans | 26.3 /100 | #194 | Fair $100,656 |
| Immigrants | South America | 23.9 /100 | #195 | Fair $100,414 |
| Samoans | 23.3 /100 | #196 | Fair $100,344 |
| Immigrants | Cameroon | 22.8 /100 | #197 | Fair $100,289 |
| Immigrants | Africa | 22.5 /100 | #198 | Fair $100,256 |
| Yugoslavians | 21.3 /100 | #199 | Fair $100,119 |
| Spanish | 20.1 /100 | #200 | Fair $99,977 |
| Immigrants | Thailand | 19.0 /100 | #201 | Poor $99,840 |
| Whites/Caucasians | 18.7 /100 | #202 | Poor $99,800 |
| Scotch-Irish | 17.1 /100 | #203 | Poor $99,591 |