Immigrants from Uzbekistan vs Choctaw Median Male Earnings
COMPARE
Immigrants from Uzbekistan
Choctaw
Median Male Earnings
Median Male Earnings Comparison
Immigrants from Uzbekistan
Choctaw
$57,941
MEDIAN MALE EARNINGS
96.7/ 100
METRIC RATING
108th/ 347
METRIC RANK
$47,729
MEDIAN MALE EARNINGS
0.1/ 100
METRIC RATING
291st/ 347
METRIC RANK
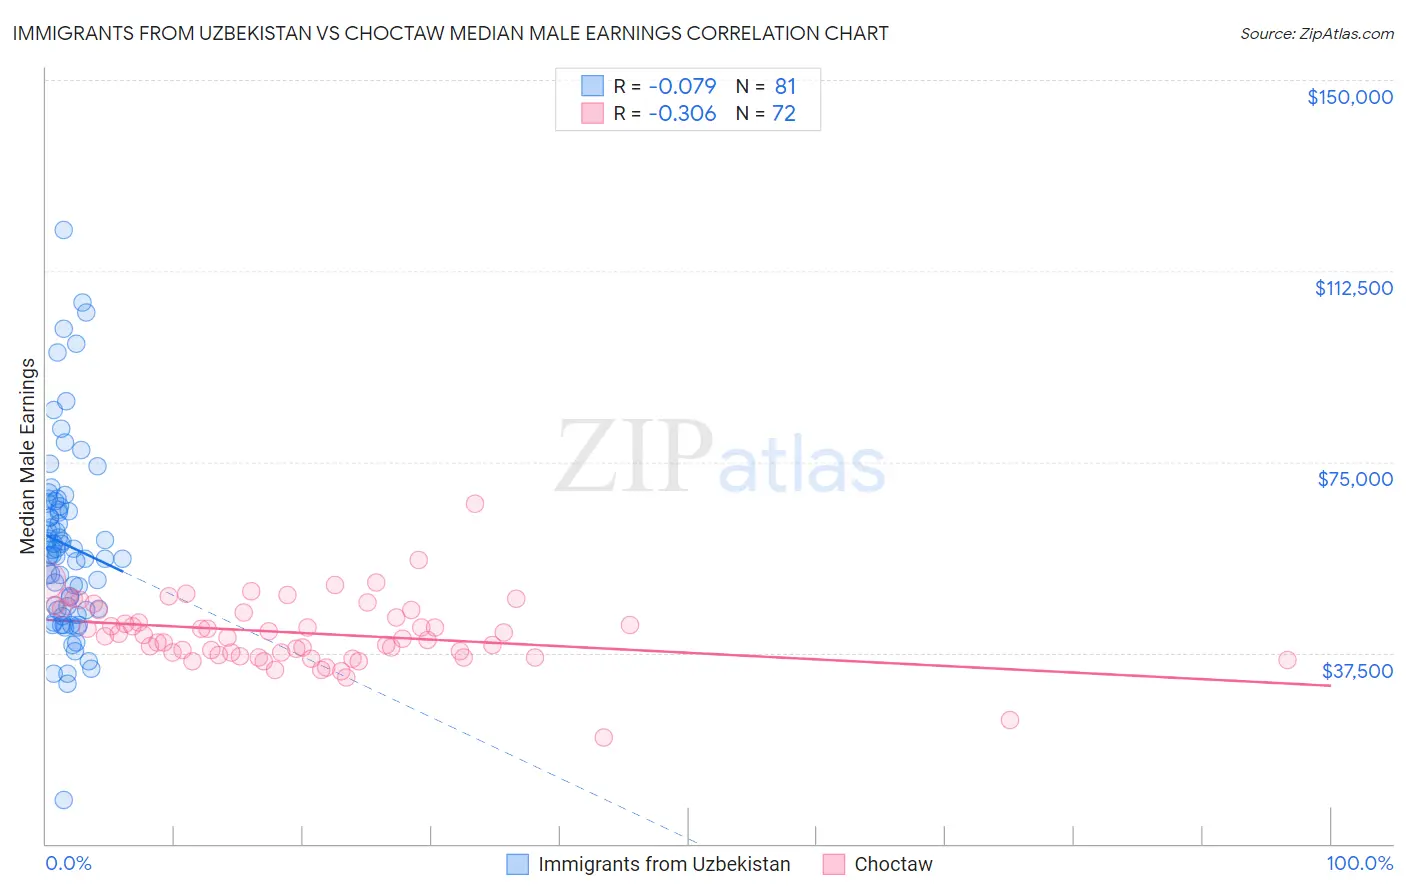
Immigrants from Uzbekistan vs Choctaw Median Male Earnings Correlation Chart
The statistical analysis conducted on geographies consisting of 118,770,599 people shows a slight negative correlation between the proportion of Immigrants from Uzbekistan and median male earnings in the United States with a correlation coefficient (R) of -0.079 and weighted average of $57,941. Similarly, the statistical analysis conducted on geographies consisting of 269,619,289 people shows a mild negative correlation between the proportion of Choctaw and median male earnings in the United States with a correlation coefficient (R) of -0.306 and weighted average of $47,729, a difference of 21.4%.
Median Male Earnings Correlation Summary
| Measurement | Immigrants from Uzbekistan | Choctaw |
| Minimum | $8,518 | $20,833 |
| Maximum | $120,441 | $66,862 |
| Range | $111,923 | $46,029 |
| Mean | $58,740 | $41,431 |
| Median | $56,668 | $40,848 |
| Interquartile 25% (IQ1) | $45,939 | $37,230 |
| Interquartile 75% (IQ3) | $66,644 | $45,935 |
| Interquartile Range (IQR) | $20,705 | $8,705 |
| Standard Deviation (Sample) | $18,622 | $6,709 |
| Standard Deviation (Population) | $18,506 | $6,663 |
Similar Demographics by Median Male Earnings
Demographics Similar to Immigrants from Uzbekistan by Median Male Earnings
In terms of median male earnings, the demographic groups most similar to Immigrants from Uzbekistan are Serbian ($57,975, a difference of 0.060%), British ($57,890, a difference of 0.090%), Immigrants from Northern Africa ($58,008, a difference of 0.12%), Palestinian ($57,778, a difference of 0.28%), and Armenian ($58,134, a difference of 0.33%).
| Demographics | Rating | Rank | Median Male Earnings |
| Immigrants | Brazil | 97.7 /100 | #101 | Exceptional $58,324 |
| Syrians | 97.4 /100 | #102 | Exceptional $58,187 |
| Poles | 97.3 /100 | #103 | Exceptional $58,139 |
| Armenians | 97.3 /100 | #104 | Exceptional $58,134 |
| Immigrants | Western Asia | 97.3 /100 | #105 | Exceptional $58,131 |
| Immigrants | Northern Africa | 96.9 /100 | #106 | Exceptional $58,008 |
| Serbians | 96.8 /100 | #107 | Exceptional $57,975 |
| Immigrants | Uzbekistan | 96.7 /100 | #108 | Exceptional $57,941 |
| British | 96.5 /100 | #109 | Exceptional $57,890 |
| Palestinians | 96.2 /100 | #110 | Exceptional $57,778 |
| Europeans | 95.6 /100 | #111 | Exceptional $57,637 |
| Immigrants | Afghanistan | 95.4 /100 | #112 | Exceptional $57,582 |
| Carpatho Rusyns | 95.3 /100 | #113 | Exceptional $57,572 |
| Immigrants | Kuwait | 95.3 /100 | #114 | Exceptional $57,562 |
| Swedes | 94.8 /100 | #115 | Exceptional $57,445 |
Demographics Similar to Choctaw by Median Male Earnings
In terms of median male earnings, the demographic groups most similar to Choctaw are Immigrants from Dominica ($47,651, a difference of 0.16%), Immigrants from Belize ($47,809, a difference of 0.17%), Chickasaw ($47,832, a difference of 0.22%), Shoshone ($47,930, a difference of 0.42%), and Indonesian ($47,503, a difference of 0.48%).
| Demographics | Rating | Rank | Median Male Earnings |
| Africans | 0.2 /100 | #284 | Tragic $47,994 |
| Paiute | 0.2 /100 | #285 | Tragic $47,991 |
| Mexican American Indians | 0.2 /100 | #286 | Tragic $47,990 |
| Immigrants | El Salvador | 0.2 /100 | #287 | Tragic $47,973 |
| Shoshone | 0.2 /100 | #288 | Tragic $47,930 |
| Chickasaw | 0.1 /100 | #289 | Tragic $47,832 |
| Immigrants | Belize | 0.1 /100 | #290 | Tragic $47,809 |
| Choctaw | 0.1 /100 | #291 | Tragic $47,729 |
| Immigrants | Dominica | 0.1 /100 | #292 | Tragic $47,651 |
| Indonesians | 0.1 /100 | #293 | Tragic $47,503 |
| Immigrants | Nicaragua | 0.1 /100 | #294 | Tragic $47,482 |
| Central American Indians | 0.1 /100 | #295 | Tragic $47,433 |
| Inupiat | 0.1 /100 | #296 | Tragic $47,281 |
| Dominicans | 0.1 /100 | #297 | Tragic $47,204 |
| Immigrants | Micronesia | 0.1 /100 | #298 | Tragic $47,177 |