Dutch West Indian vs Choctaw Median Male Earnings
COMPARE
Dutch West Indian
Choctaw
Median Male Earnings
Median Male Earnings Comparison
Dutch West Indians
Choctaw
$46,656
MEDIAN MALE EARNINGS
0.0/ 100
METRIC RATING
306th/ 347
METRIC RANK
$47,729
MEDIAN MALE EARNINGS
0.1/ 100
METRIC RATING
291st/ 347
METRIC RANK
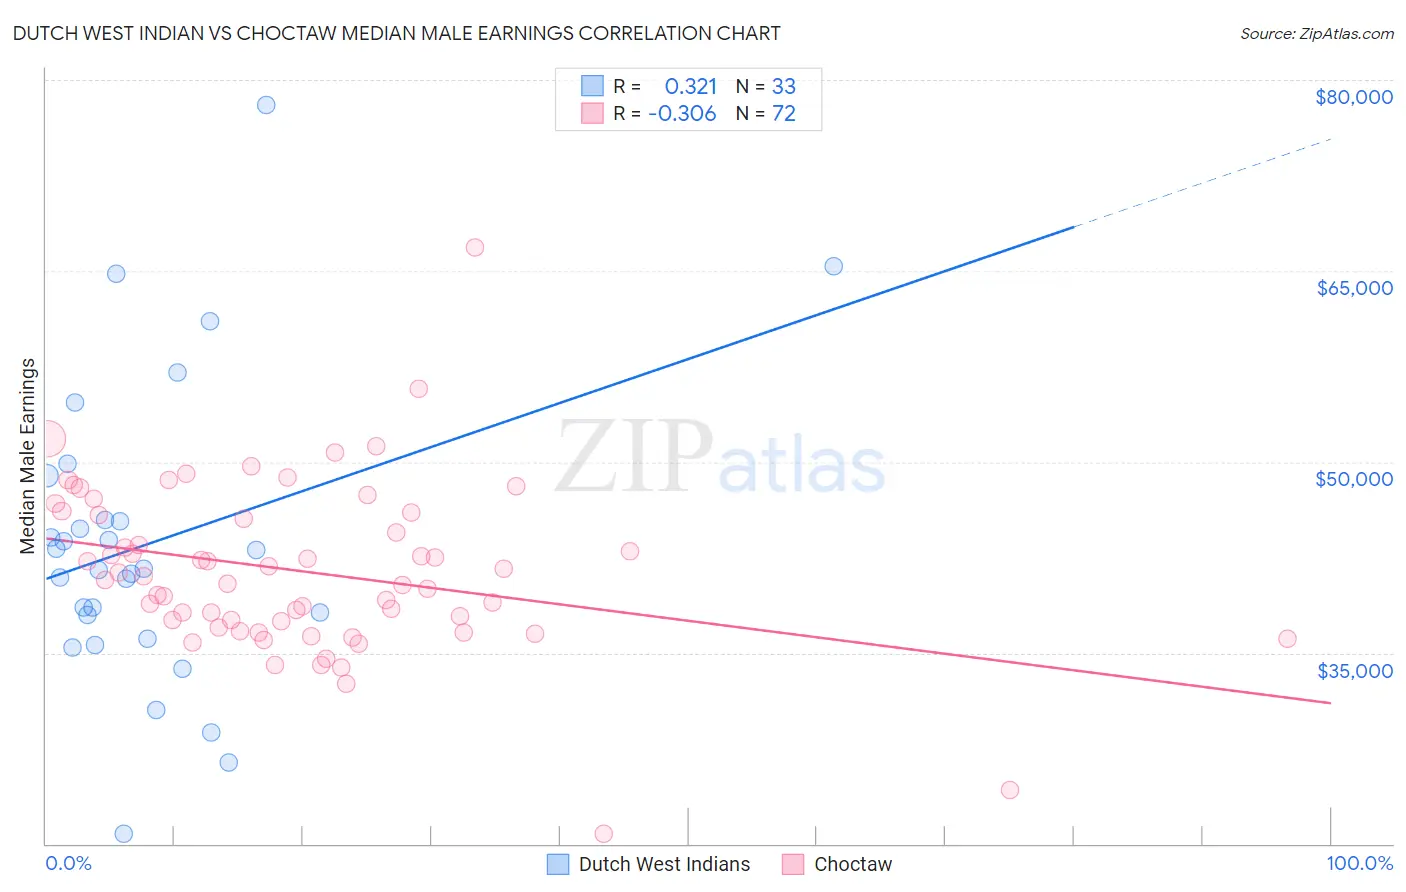
Dutch West Indian vs Choctaw Median Male Earnings Correlation Chart
The statistical analysis conducted on geographies consisting of 85,752,443 people shows a mild positive correlation between the proportion of Dutch West Indians and median male earnings in the United States with a correlation coefficient (R) of 0.321 and weighted average of $46,656. Similarly, the statistical analysis conducted on geographies consisting of 269,619,289 people shows a mild negative correlation between the proportion of Choctaw and median male earnings in the United States with a correlation coefficient (R) of -0.306 and weighted average of $47,729, a difference of 2.3%.
Median Male Earnings Correlation Summary
| Measurement | Dutch West Indian | Choctaw |
| Minimum | $20,833 | $20,833 |
| Maximum | $78,036 | $66,862 |
| Range | $57,203 | $46,029 |
| Mean | $43,636 | $41,431 |
| Median | $41,596 | $40,848 |
| Interquartile 25% (IQ1) | $37,034 | $37,230 |
| Interquartile 75% (IQ3) | $47,172 | $45,935 |
| Interquartile Range (IQR) | $10,138 | $8,705 |
| Standard Deviation (Sample) | $11,759 | $6,709 |
| Standard Deviation (Population) | $11,579 | $6,663 |
Demographics Similar to Dutch West Indians and Choctaw by Median Male Earnings
In terms of median male earnings, the demographic groups most similar to Dutch West Indians are Immigrants from Dominican Republic ($46,655, a difference of 0.0%), Ottawa ($46,611, a difference of 0.10%), Guatemalan ($46,736, a difference of 0.17%), Bangladeshi ($46,744, a difference of 0.19%), and Yaqui ($46,777, a difference of 0.26%). Similarly, the demographic groups most similar to Choctaw are Immigrants from Dominica ($47,651, a difference of 0.16%), Immigrants from Belize ($47,809, a difference of 0.17%), Chickasaw ($47,832, a difference of 0.22%), Shoshone ($47,930, a difference of 0.42%), and Indonesian ($47,503, a difference of 0.48%).
| Demographics | Rating | Rank | Median Male Earnings |
| Shoshone | 0.2 /100 | #288 | Tragic $47,930 |
| Chickasaw | 0.1 /100 | #289 | Tragic $47,832 |
| Immigrants | Belize | 0.1 /100 | #290 | Tragic $47,809 |
| Choctaw | 0.1 /100 | #291 | Tragic $47,729 |
| Immigrants | Dominica | 0.1 /100 | #292 | Tragic $47,651 |
| Indonesians | 0.1 /100 | #293 | Tragic $47,503 |
| Immigrants | Nicaragua | 0.1 /100 | #294 | Tragic $47,482 |
| Central American Indians | 0.1 /100 | #295 | Tragic $47,433 |
| Inupiat | 0.1 /100 | #296 | Tragic $47,281 |
| Dominicans | 0.1 /100 | #297 | Tragic $47,204 |
| Immigrants | Micronesia | 0.1 /100 | #298 | Tragic $47,177 |
| Immigrants | Zaire | 0.1 /100 | #299 | Tragic $47,070 |
| U.S. Virgin Islanders | 0.1 /100 | #300 | Tragic $47,066 |
| Immigrants | Latin America | 0.1 /100 | #301 | Tragic $46,941 |
| Seminole | 0.1 /100 | #302 | Tragic $46,783 |
| Yaqui | 0.1 /100 | #303 | Tragic $46,777 |
| Bangladeshis | 0.1 /100 | #304 | Tragic $46,744 |
| Guatemalans | 0.0 /100 | #305 | Tragic $46,736 |
| Dutch West Indians | 0.0 /100 | #306 | Tragic $46,656 |
| Immigrants | Dominican Republic | 0.0 /100 | #307 | Tragic $46,655 |
| Ottawa | 0.0 /100 | #308 | Tragic $46,611 |