Israeli vs Alsatian Wage/Income Gap
COMPARE
Israeli
Alsatian
Wage/Income Gap
Wage/Income Gap Comparison
Israelis
Alsatians
27.4%
WAGE/INCOME GAP
2.1/ 100
METRIC RATING
254th/ 347
METRIC RANK
24.7%
WAGE/INCOME GAP
93.2/ 100
METRIC RATING
130th/ 347
METRIC RANK
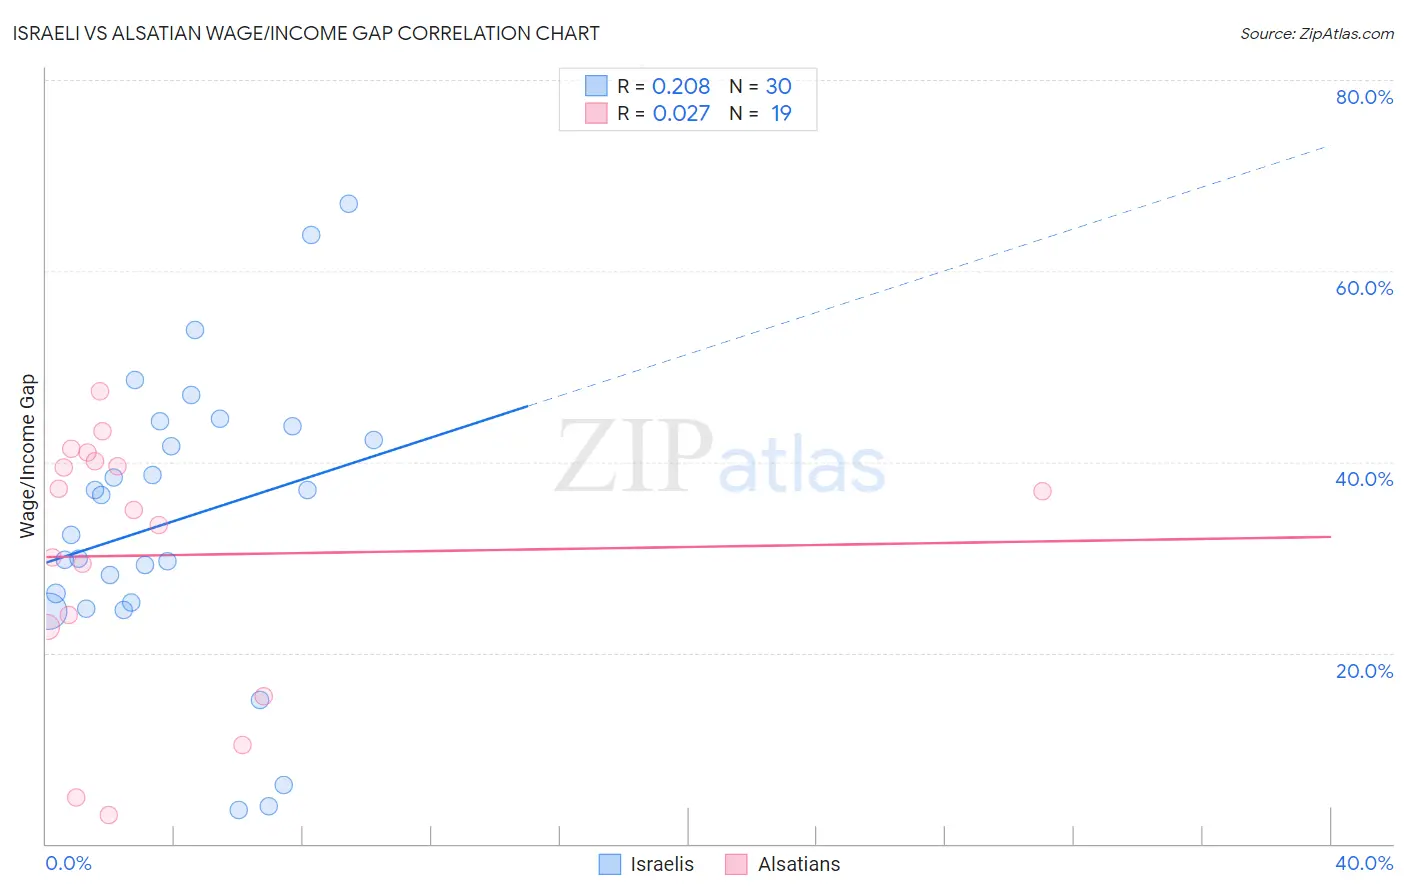
Israeli vs Alsatian Wage/Income Gap Correlation Chart
The statistical analysis conducted on geographies consisting of 211,160,371 people shows a weak positive correlation between the proportion of Israelis and wage/income gap percentage in the United States with a correlation coefficient (R) of 0.208 and weighted average of 27.4%. Similarly, the statistical analysis conducted on geographies consisting of 82,663,210 people shows no correlation between the proportion of Alsatians and wage/income gap percentage in the United States with a correlation coefficient (R) of 0.027 and weighted average of 24.7%, a difference of 11.0%.
Wage/Income Gap Correlation Summary
| Measurement | Israeli | Alsatian |
| Minimum | 3.5% | 3.0% |
| Maximum | 67.0% | 47.4% |
| Range | 63.5% | 44.4% |
| Mean | 33.9% | 30.2% |
| Median | 34.4% | 35.0% |
| Interquartile 25% (IQ1) | 25.3% | 22.7% |
| Interquartile 75% (IQ3) | 43.8% | 40.1% |
| Interquartile Range (IQR) | 18.5% | 17.4% |
| Standard Deviation (Sample) | 15.2% | 13.3% |
| Standard Deviation (Population) | 15.0% | 13.0% |
Similar Demographics by Wage/Income Gap
Demographics Similar to Israelis by Wage/Income Gap
In terms of wage/income gap, the demographic groups most similar to Israelis are Immigrants from France (27.4%, a difference of 0.010%), Portuguese (27.4%, a difference of 0.080%), Cherokee (27.4%, a difference of 0.11%), Luxembourger (27.4%, a difference of 0.16%), and Slavic (27.4%, a difference of 0.20%).
| Demographics | Rating | Rank | Wage/Income Gap |
| Celtics | 2.8 /100 | #247 | Tragic 27.3% |
| Cypriots | 2.8 /100 | #248 | Tragic 27.3% |
| Carpatho Rusyns | 2.7 /100 | #249 | Tragic 27.3% |
| Immigrants | Czechoslovakia | 2.7 /100 | #250 | Tragic 27.3% |
| Immigrants | Norway | 2.5 /100 | #251 | Tragic 27.3% |
| Ukrainians | 2.4 /100 | #252 | Tragic 27.3% |
| Portuguese | 2.2 /100 | #253 | Tragic 27.4% |
| Israelis | 2.1 /100 | #254 | Tragic 27.4% |
| Immigrants | France | 2.1 /100 | #255 | Tragic 27.4% |
| Cherokee | 1.9 /100 | #256 | Tragic 27.4% |
| Luxembourgers | 1.9 /100 | #257 | Tragic 27.4% |
| Slavs | 1.8 /100 | #258 | Tragic 27.4% |
| Icelanders | 1.8 /100 | #259 | Tragic 27.5% |
| Tongans | 1.7 /100 | #260 | Tragic 27.5% |
| Immigrants | Germany | 1.5 /100 | #261 | Tragic 27.5% |
Demographics Similar to Alsatians by Wage/Income Gap
In terms of wage/income gap, the demographic groups most similar to Alsatians are Yup'ik (24.7%, a difference of 0.020%), Immigrants from Philippines (24.7%, a difference of 0.070%), Immigrants from Central America (24.6%, a difference of 0.080%), German Russian (24.6%, a difference of 0.14%), and Immigrants from Uruguay (24.6%, a difference of 0.15%).
| Demographics | Rating | Rank | Wage/Income Gap |
| Natives/Alaskans | 94.6 /100 | #123 | Exceptional 24.6% |
| Immigrants | South America | 93.9 /100 | #124 | Exceptional 24.6% |
| Spanish Americans | 93.8 /100 | #125 | Exceptional 24.6% |
| Immigrants | Uruguay | 93.8 /100 | #126 | Exceptional 24.6% |
| German Russians | 93.7 /100 | #127 | Exceptional 24.6% |
| Immigrants | Central America | 93.5 /100 | #128 | Exceptional 24.6% |
| Yup'ik | 93.3 /100 | #129 | Exceptional 24.7% |
| Alsatians | 93.2 /100 | #130 | Exceptional 24.7% |
| Immigrants | Philippines | 93.0 /100 | #131 | Exceptional 24.7% |
| Immigrants | Costa Rica | 92.4 /100 | #132 | Exceptional 24.7% |
| Colombians | 92.4 /100 | #133 | Exceptional 24.7% |
| Mexican American Indians | 92.2 /100 | #134 | Exceptional 24.7% |
| South American Indians | 92.0 /100 | #135 | Exceptional 24.7% |
| Armenians | 91.3 /100 | #136 | Exceptional 24.8% |
| Immigrants | South Eastern Asia | 90.9 /100 | #137 | Exceptional 24.8% |