Iroquois vs Cypriot Median Family Income
COMPARE
Iroquois
Cypriot
Median Family Income
Median Family Income Comparison
Iroquois
Cypriots
$90,543
MEDIAN FAMILY INCOME
0.2/ 100
METRIC RATING
271st/ 347
METRIC RANK
$127,064
MEDIAN FAMILY INCOME
100.0/ 100
METRIC RATING
12th/ 347
METRIC RANK
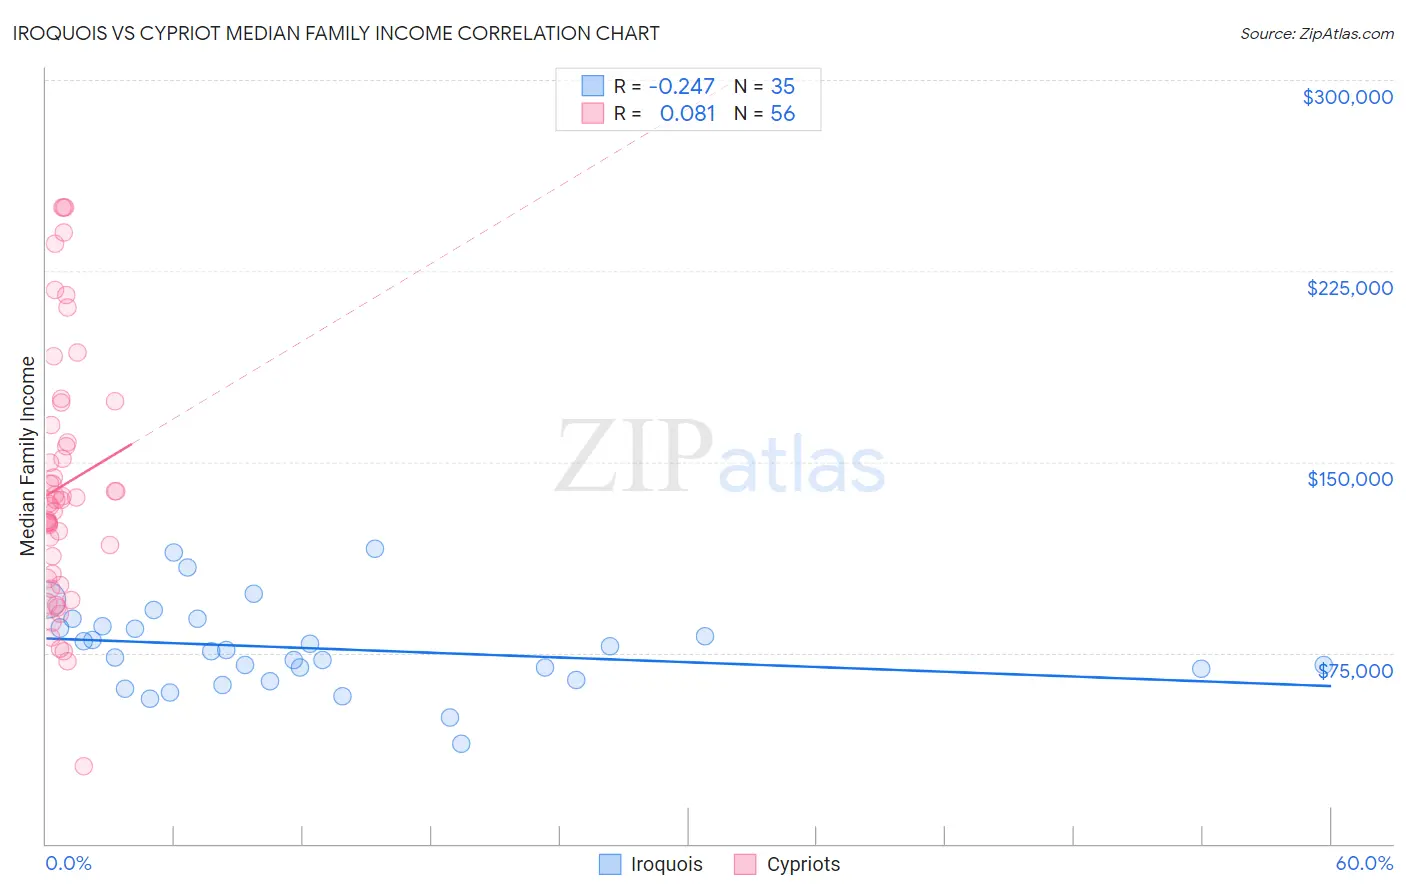
Iroquois vs Cypriot Median Family Income Correlation Chart
The statistical analysis conducted on geographies consisting of 207,203,022 people shows a weak negative correlation between the proportion of Iroquois and median family income in the United States with a correlation coefficient (R) of -0.247 and weighted average of $90,543. Similarly, the statistical analysis conducted on geographies consisting of 61,838,668 people shows a slight positive correlation between the proportion of Cypriots and median family income in the United States with a correlation coefficient (R) of 0.081 and weighted average of $127,064, a difference of 40.3%.
Median Family Income Correlation Summary
| Measurement | Iroquois | Cypriot |
| Minimum | $39,479 | $30,441 |
| Maximum | $115,891 | $250,001 |
| Range | $76,412 | $219,560 |
| Mean | $76,689 | $140,451 |
| Median | $75,795 | $134,246 |
| Interquartile 25% (IQ1) | $64,141 | $104,944 |
| Interquartile 75% (IQ3) | $85,646 | $161,047 |
| Interquartile Range (IQR) | $21,505 | $56,103 |
| Standard Deviation (Sample) | $16,973 | $49,252 |
| Standard Deviation (Population) | $16,729 | $48,811 |
Similar Demographics by Median Family Income
Demographics Similar to Iroquois by Median Family Income
In terms of median family income, the demographic groups most similar to Iroquois are Jamaican ($90,581, a difference of 0.040%), Immigrants from Liberia ($90,450, a difference of 0.10%), Immigrants from Micronesia ($90,345, a difference of 0.22%), Spanish American ($90,322, a difference of 0.24%), and Cree ($90,882, a difference of 0.37%).
| Demographics | Rating | Rank | Median Family Income |
| Senegalese | 0.3 /100 | #264 | Tragic $91,475 |
| Hmong | 0.3 /100 | #265 | Tragic $91,296 |
| Central Americans | 0.3 /100 | #266 | Tragic $91,087 |
| Mexican American Indians | 0.2 /100 | #267 | Tragic $90,918 |
| Cree | 0.2 /100 | #268 | Tragic $90,882 |
| Belizeans | 0.2 /100 | #269 | Tragic $90,880 |
| Jamaicans | 0.2 /100 | #270 | Tragic $90,581 |
| Iroquois | 0.2 /100 | #271 | Tragic $90,543 |
| Immigrants | Liberia | 0.2 /100 | #272 | Tragic $90,450 |
| Immigrants | Micronesia | 0.2 /100 | #273 | Tragic $90,345 |
| Spanish Americans | 0.2 /100 | #274 | Tragic $90,322 |
| Immigrants | St. Vincent and the Grenadines | 0.2 /100 | #275 | Tragic $90,094 |
| Immigrants | Zaire | 0.1 /100 | #276 | Tragic $89,285 |
| Immigrants | Jamaica | 0.1 /100 | #277 | Tragic $89,268 |
| Immigrants | Grenada | 0.1 /100 | #278 | Tragic $89,249 |
Demographics Similar to Cypriots by Median Family Income
In terms of median family income, the demographic groups most similar to Cypriots are Immigrants from Israel ($127,430, a difference of 0.29%), Immigrants from Australia ($126,620, a difference of 0.35%), Immigrants from Ireland ($127,584, a difference of 0.41%), Immigrants from South Central Asia ($125,956, a difference of 0.88%), and Eastern European ($125,546, a difference of 1.2%).
| Demographics | Rating | Rank | Median Family Income |
| Iranians | 100.0 /100 | #5 | Exceptional $133,839 |
| Thais | 100.0 /100 | #6 | Exceptional $131,281 |
| Immigrants | Hong Kong | 100.0 /100 | #7 | Exceptional $131,067 |
| Immigrants | Iran | 100.0 /100 | #8 | Exceptional $130,894 |
| Okinawans | 100.0 /100 | #9 | Exceptional $129,979 |
| Immigrants | Ireland | 100.0 /100 | #10 | Exceptional $127,584 |
| Immigrants | Israel | 100.0 /100 | #11 | Exceptional $127,430 |
| Cypriots | 100.0 /100 | #12 | Exceptional $127,064 |
| Immigrants | Australia | 100.0 /100 | #13 | Exceptional $126,620 |
| Immigrants | South Central Asia | 100.0 /100 | #14 | Exceptional $125,956 |
| Eastern Europeans | 100.0 /100 | #15 | Exceptional $125,546 |
| Immigrants | China | 100.0 /100 | #16 | Exceptional $125,540 |
| Indians (Asian) | 100.0 /100 | #17 | Exceptional $125,312 |
| Immigrants | Eastern Asia | 100.0 /100 | #18 | Exceptional $125,150 |
| Immigrants | Belgium | 100.0 /100 | #19 | Exceptional $123,831 |