Iroquois vs Immigrants from Burma/Myanmar Median Family Income
COMPARE
Iroquois
Immigrants from Burma/Myanmar
Median Family Income
Median Family Income Comparison
Iroquois
Immigrants from Burma/Myanmar
$90,543
MEDIAN FAMILY INCOME
0.2/ 100
METRIC RATING
271st/ 347
METRIC RANK
$94,472
MEDIAN FAMILY INCOME
1.5/ 100
METRIC RATING
235th/ 347
METRIC RANK
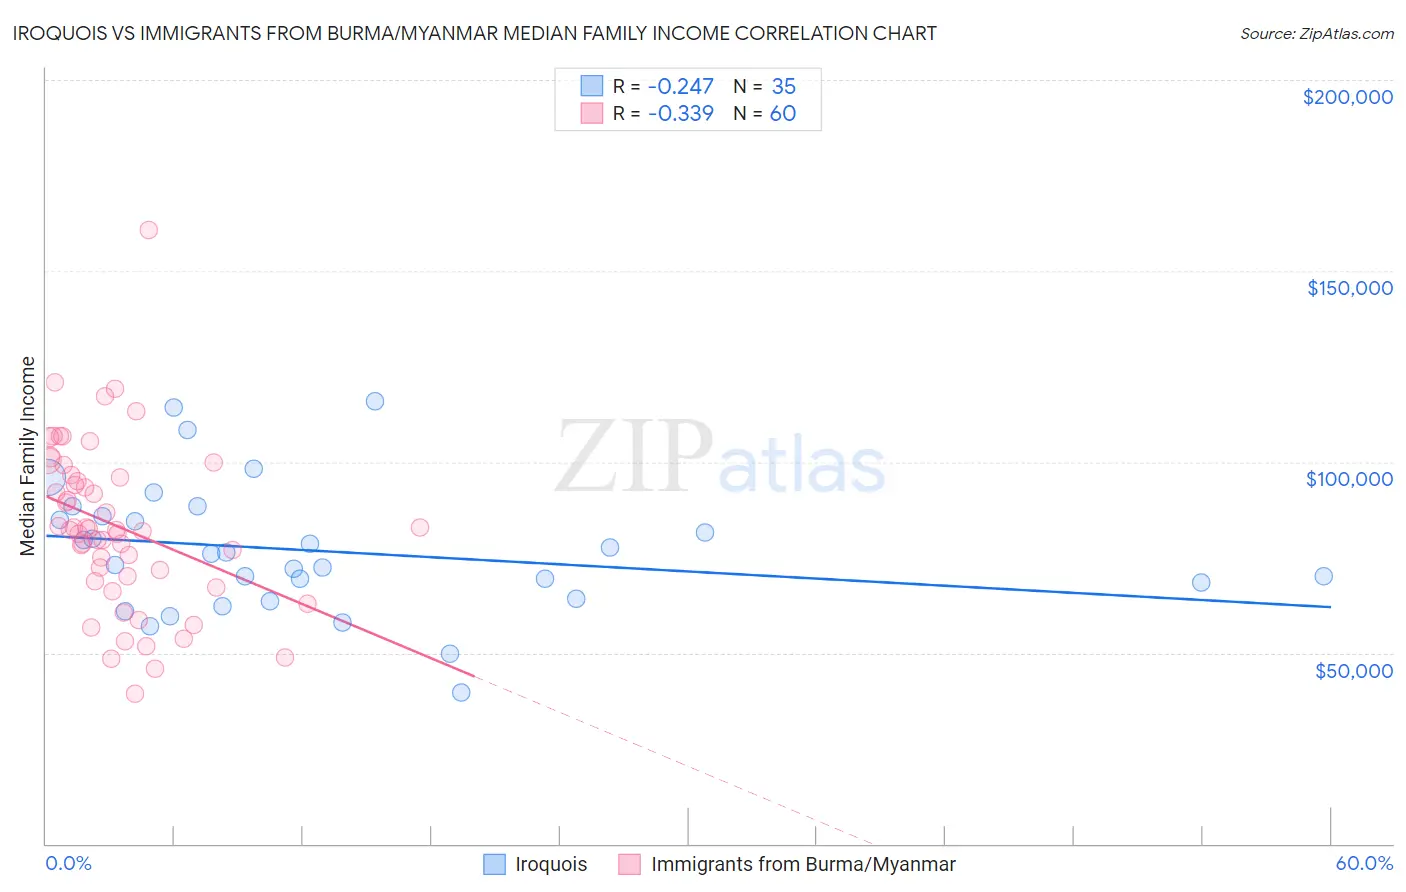
Iroquois vs Immigrants from Burma/Myanmar Median Family Income Correlation Chart
The statistical analysis conducted on geographies consisting of 207,203,022 people shows a weak negative correlation between the proportion of Iroquois and median family income in the United States with a correlation coefficient (R) of -0.247 and weighted average of $90,543. Similarly, the statistical analysis conducted on geographies consisting of 172,231,822 people shows a mild negative correlation between the proportion of Immigrants from Burma/Myanmar and median family income in the United States with a correlation coefficient (R) of -0.339 and weighted average of $94,472, a difference of 4.3%.
Median Family Income Correlation Summary
| Measurement | Iroquois | Immigrants from Burma/Myanmar |
| Minimum | $39,479 | $39,136 |
| Maximum | $115,891 | $160,863 |
| Range | $76,412 | $121,727 |
| Mean | $76,689 | $83,083 |
| Median | $75,795 | $82,122 |
| Interquartile 25% (IQ1) | $64,141 | $69,331 |
| Interquartile 75% (IQ3) | $85,646 | $96,286 |
| Interquartile Range (IQR) | $21,505 | $26,955 |
| Standard Deviation (Sample) | $16,973 | $21,974 |
| Standard Deviation (Population) | $16,729 | $21,790 |
Similar Demographics by Median Family Income
Demographics Similar to Iroquois by Median Family Income
In terms of median family income, the demographic groups most similar to Iroquois are Jamaican ($90,581, a difference of 0.040%), Immigrants from Liberia ($90,450, a difference of 0.10%), Immigrants from Micronesia ($90,345, a difference of 0.22%), Spanish American ($90,322, a difference of 0.24%), and Cree ($90,882, a difference of 0.37%).
| Demographics | Rating | Rank | Median Family Income |
| Senegalese | 0.3 /100 | #264 | Tragic $91,475 |
| Hmong | 0.3 /100 | #265 | Tragic $91,296 |
| Central Americans | 0.3 /100 | #266 | Tragic $91,087 |
| Mexican American Indians | 0.2 /100 | #267 | Tragic $90,918 |
| Cree | 0.2 /100 | #268 | Tragic $90,882 |
| Belizeans | 0.2 /100 | #269 | Tragic $90,880 |
| Jamaicans | 0.2 /100 | #270 | Tragic $90,581 |
| Iroquois | 0.2 /100 | #271 | Tragic $90,543 |
| Immigrants | Liberia | 0.2 /100 | #272 | Tragic $90,450 |
| Immigrants | Micronesia | 0.2 /100 | #273 | Tragic $90,345 |
| Spanish Americans | 0.2 /100 | #274 | Tragic $90,322 |
| Immigrants | St. Vincent and the Grenadines | 0.2 /100 | #275 | Tragic $90,094 |
| Immigrants | Zaire | 0.1 /100 | #276 | Tragic $89,285 |
| Immigrants | Jamaica | 0.1 /100 | #277 | Tragic $89,268 |
| Immigrants | Grenada | 0.1 /100 | #278 | Tragic $89,249 |
Demographics Similar to Immigrants from Burma/Myanmar by Median Family Income
In terms of median family income, the demographic groups most similar to Immigrants from Burma/Myanmar are Trinidadian and Tobagonian ($94,466, a difference of 0.010%), Alaskan Athabascan ($94,429, a difference of 0.040%), Immigrants from Western Africa ($94,638, a difference of 0.18%), Immigrants from Bangladesh ($94,665, a difference of 0.20%), and Nepalese ($94,153, a difference of 0.34%).
| Demographics | Rating | Rank | Median Family Income |
| Immigrants | Azores | 2.4 /100 | #228 | Tragic $95,402 |
| Marshallese | 2.2 /100 | #229 | Tragic $95,293 |
| Malaysians | 2.2 /100 | #230 | Tragic $95,230 |
| Ecuadorians | 2.1 /100 | #231 | Tragic $95,114 |
| Immigrants | Venezuela | 1.9 /100 | #232 | Tragic $94,904 |
| Immigrants | Bangladesh | 1.6 /100 | #233 | Tragic $94,665 |
| Immigrants | Western Africa | 1.6 /100 | #234 | Tragic $94,638 |
| Immigrants | Burma/Myanmar | 1.5 /100 | #235 | Tragic $94,472 |
| Trinidadians and Tobagonians | 1.5 /100 | #236 | Tragic $94,466 |
| Alaskan Athabascans | 1.5 /100 | #237 | Tragic $94,429 |
| Nepalese | 1.3 /100 | #238 | Tragic $94,153 |
| Salvadorans | 1.2 /100 | #239 | Tragic $94,109 |
| Somalis | 1.2 /100 | #240 | Tragic $94,085 |
| Immigrants | Trinidad and Tobago | 1.2 /100 | #241 | Tragic $93,988 |
| Barbadians | 1.1 /100 | #242 | Tragic $93,919 |