Iroquois vs French Canadian Median Family Income
COMPARE
Iroquois
French Canadian
Median Family Income
Median Family Income Comparison
Iroquois
French Canadians
$90,543
MEDIAN FAMILY INCOME
0.2/ 100
METRIC RATING
271st/ 347
METRIC RANK
$101,634
MEDIAN FAMILY INCOME
37.0/ 100
METRIC RATING
180th/ 347
METRIC RANK
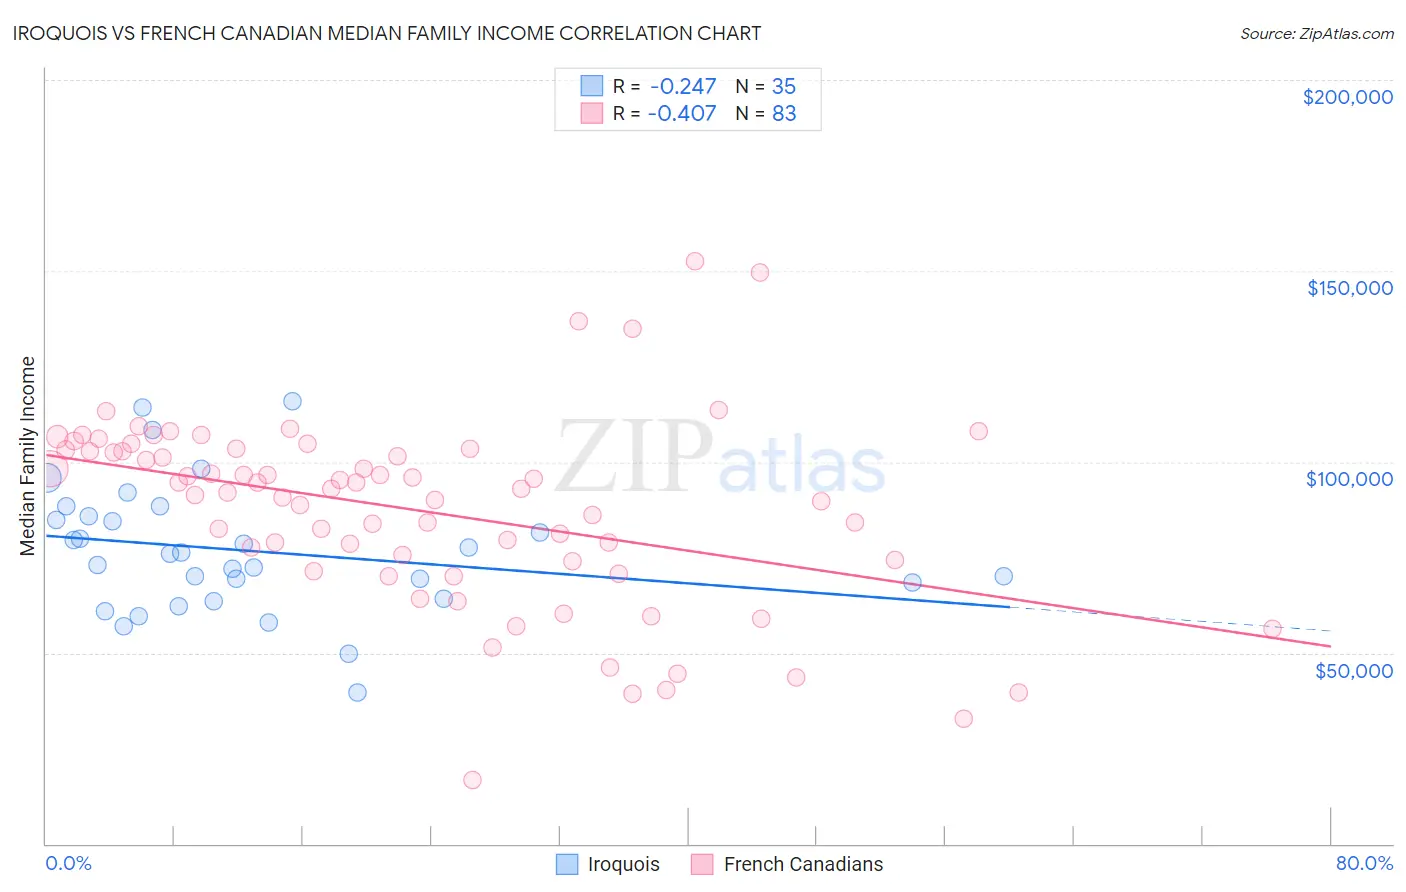
Iroquois vs French Canadian Median Family Income Correlation Chart
The statistical analysis conducted on geographies consisting of 207,203,022 people shows a weak negative correlation between the proportion of Iroquois and median family income in the United States with a correlation coefficient (R) of -0.247 and weighted average of $90,543. Similarly, the statistical analysis conducted on geographies consisting of 501,962,577 people shows a moderate negative correlation between the proportion of French Canadians and median family income in the United States with a correlation coefficient (R) of -0.407 and weighted average of $101,634, a difference of 12.2%.
Median Family Income Correlation Summary
| Measurement | Iroquois | French Canadian |
| Minimum | $39,479 | $16,696 |
| Maximum | $115,891 | $152,574 |
| Range | $76,412 | $135,878 |
| Mean | $76,689 | $87,243 |
| Median | $75,795 | $92,910 |
| Interquartile 25% (IQ1) | $64,141 | $74,042 |
| Interquartile 75% (IQ3) | $85,646 | $103,222 |
| Interquartile Range (IQR) | $21,505 | $29,180 |
| Standard Deviation (Sample) | $16,973 | $24,938 |
| Standard Deviation (Population) | $16,729 | $24,788 |
Similar Demographics by Median Family Income
Demographics Similar to Iroquois by Median Family Income
In terms of median family income, the demographic groups most similar to Iroquois are Jamaican ($90,581, a difference of 0.040%), Immigrants from Liberia ($90,450, a difference of 0.10%), Immigrants from Micronesia ($90,345, a difference of 0.22%), Spanish American ($90,322, a difference of 0.24%), and Cree ($90,882, a difference of 0.37%).
| Demographics | Rating | Rank | Median Family Income |
| Senegalese | 0.3 /100 | #264 | Tragic $91,475 |
| Hmong | 0.3 /100 | #265 | Tragic $91,296 |
| Central Americans | 0.3 /100 | #266 | Tragic $91,087 |
| Mexican American Indians | 0.2 /100 | #267 | Tragic $90,918 |
| Cree | 0.2 /100 | #268 | Tragic $90,882 |
| Belizeans | 0.2 /100 | #269 | Tragic $90,880 |
| Jamaicans | 0.2 /100 | #270 | Tragic $90,581 |
| Iroquois | 0.2 /100 | #271 | Tragic $90,543 |
| Immigrants | Liberia | 0.2 /100 | #272 | Tragic $90,450 |
| Immigrants | Micronesia | 0.2 /100 | #273 | Tragic $90,345 |
| Spanish Americans | 0.2 /100 | #274 | Tragic $90,322 |
| Immigrants | St. Vincent and the Grenadines | 0.2 /100 | #275 | Tragic $90,094 |
| Immigrants | Zaire | 0.1 /100 | #276 | Tragic $89,285 |
| Immigrants | Jamaica | 0.1 /100 | #277 | Tragic $89,268 |
| Immigrants | Grenada | 0.1 /100 | #278 | Tragic $89,249 |
Demographics Similar to French Canadians by Median Family Income
In terms of median family income, the demographic groups most similar to French Canadians are Spaniard ($101,617, a difference of 0.020%), Tsimshian ($101,543, a difference of 0.090%), Kenyan ($101,417, a difference of 0.21%), South American ($101,856, a difference of 0.22%), and Immigrants from Costa Rica ($101,354, a difference of 0.28%).
| Demographics | Rating | Rank | Median Family Income |
| Belgians | 51.4 /100 | #173 | Average $102,788 |
| Finns | 50.0 /100 | #174 | Average $102,676 |
| Immigrants | Eastern Africa | 47.1 /100 | #175 | Average $102,451 |
| French | 46.1 /100 | #176 | Average $102,368 |
| Germans | 44.6 /100 | #177 | Average $102,254 |
| Welsh | 43.3 /100 | #178 | Average $102,151 |
| South Americans | 39.7 /100 | #179 | Fair $101,856 |
| French Canadians | 37.0 /100 | #180 | Fair $101,634 |
| Spaniards | 36.8 /100 | #181 | Fair $101,617 |
| Tsimshian | 35.9 /100 | #182 | Fair $101,543 |
| Kenyans | 34.5 /100 | #183 | Fair $101,417 |
| Immigrants | Costa Rica | 33.7 /100 | #184 | Fair $101,354 |
| Dutch | 31.9 /100 | #185 | Fair $101,192 |
| Celtics | 31.3 /100 | #186 | Fair $101,139 |
| Tlingit-Haida | 30.8 /100 | #187 | Fair $101,092 |