Irish vs Immigrants from Czechoslovakia Median Household Income
COMPARE
Irish
Immigrants from Czechoslovakia
Median Household Income
Median Household Income Comparison
Irish
Immigrants from Czechoslovakia
$86,145
MEDIAN HOUSEHOLD INCOME
66.2/ 100
METRIC RATING
164th/ 347
METRIC RANK
$95,319
MEDIAN HOUSEHOLD INCOME
99.9/ 100
METRIC RATING
55th/ 347
METRIC RANK
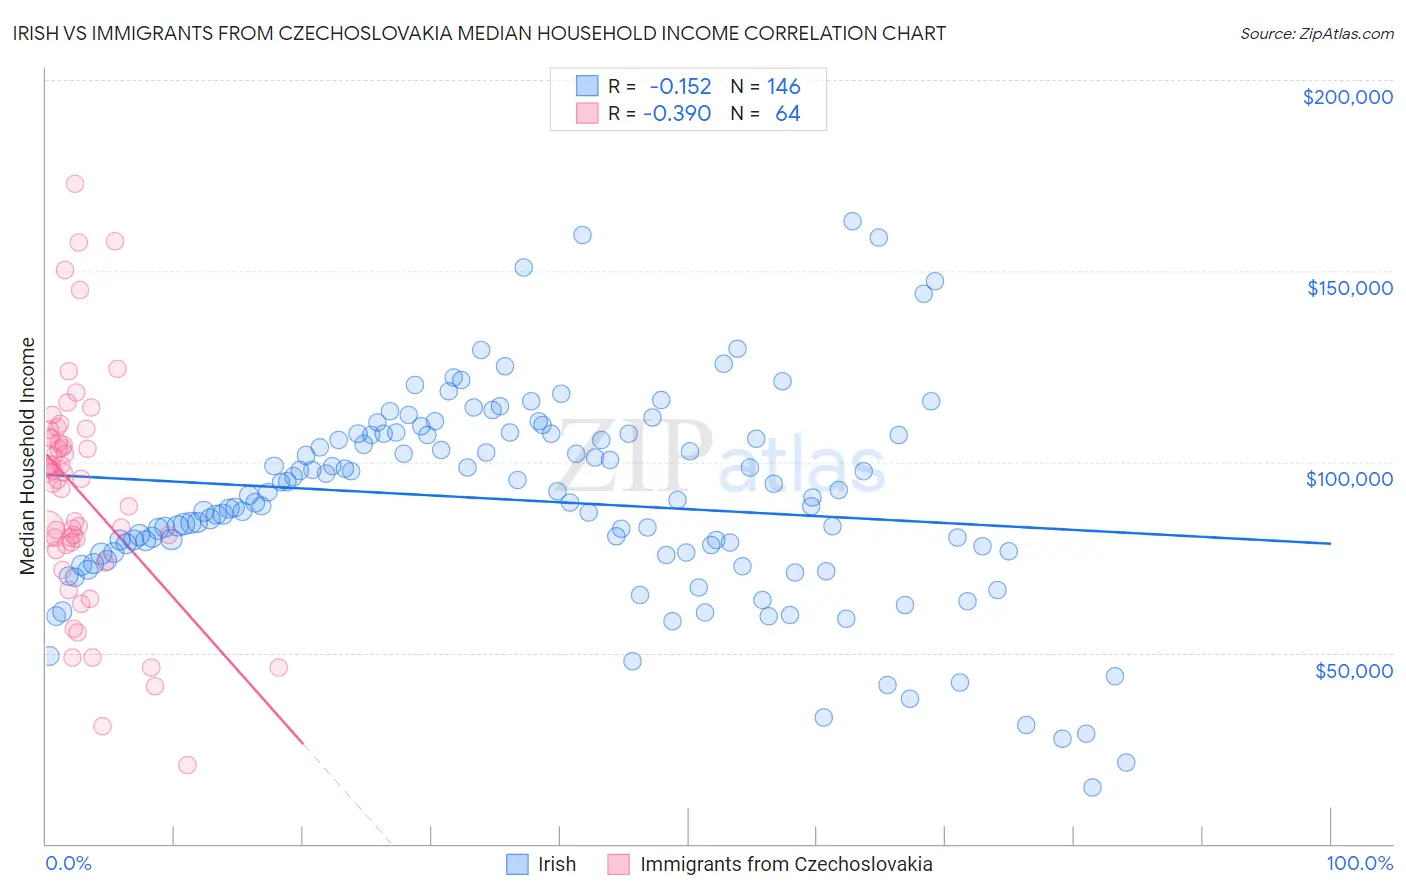
Irish vs Immigrants from Czechoslovakia Median Household Income Correlation Chart
The statistical analysis conducted on geographies consisting of 579,055,037 people shows a poor negative correlation between the proportion of Irish and median household income in the United States with a correlation coefficient (R) of -0.152 and weighted average of $86,145. Similarly, the statistical analysis conducted on geographies consisting of 195,443,038 people shows a mild negative correlation between the proportion of Immigrants from Czechoslovakia and median household income in the United States with a correlation coefficient (R) of -0.390 and weighted average of $95,319, a difference of 10.6%.
Median Household Income Correlation Summary
| Measurement | Irish | Immigrants from Czechoslovakia |
| Minimum | $14,837 | $20,761 |
| Maximum | $162,948 | $172,802 |
| Range | $148,111 | $152,041 |
| Mean | $89,921 | $91,959 |
| Median | $89,704 | $95,339 |
| Interquartile 25% (IQ1) | $76,304 | $78,538 |
| Interquartile 75% (IQ3) | $107,042 | $106,288 |
| Interquartile Range (IQR) | $30,738 | $27,750 |
| Standard Deviation (Sample) | $26,625 | $29,573 |
| Standard Deviation (Population) | $26,534 | $29,341 |
Similar Demographics by Median Household Income
Demographics Similar to Irish by Median Household Income
In terms of median household income, the demographic groups most similar to Irish are Czech ($86,164, a difference of 0.020%), Norwegian ($86,084, a difference of 0.070%), Scandinavian ($86,073, a difference of 0.080%), Guamanian/Chamorro ($86,255, a difference of 0.13%), and Slavic ($86,398, a difference of 0.29%).
| Demographics | Rating | Rank | Median Household Income |
| Samoans | 71.0 /100 | #157 | Good $86,498 |
| Moroccans | 70.6 /100 | #158 | Good $86,468 |
| Immigrants | Uzbekistan | 70.1 /100 | #159 | Good $86,425 |
| Luxembourgers | 70.0 /100 | #160 | Good $86,418 |
| Slavs | 69.7 /100 | #161 | Good $86,398 |
| Guamanians/Chamorros | 67.7 /100 | #162 | Good $86,255 |
| Czechs | 66.4 /100 | #163 | Good $86,164 |
| Irish | 66.2 /100 | #164 | Good $86,145 |
| Norwegians | 65.3 /100 | #165 | Good $86,084 |
| Scandinavians | 65.1 /100 | #166 | Good $86,073 |
| Immigrants | Immigrants | 61.3 /100 | #167 | Good $85,818 |
| Icelanders | 61.0 /100 | #168 | Good $85,797 |
| Colombians | 59.7 /100 | #169 | Average $85,716 |
| Swiss | 59.2 /100 | #170 | Average $85,681 |
| Immigrants | South America | 58.1 /100 | #171 | Average $85,611 |
Demographics Similar to Immigrants from Czechoslovakia by Median Household Income
In terms of median household income, the demographic groups most similar to Immigrants from Czechoslovakia are Immigrants from Austria ($95,277, a difference of 0.040%), New Zealander ($95,146, a difference of 0.18%), Soviet Union ($95,098, a difference of 0.23%), Immigrants from Europe ($95,032, a difference of 0.30%), and Korean ($95,018, a difference of 0.32%).
| Demographics | Rating | Rank | Median Household Income |
| Cambodians | 99.9 /100 | #48 | Exceptional $96,324 |
| Immigrants | Malaysia | 99.9 /100 | #49 | Exceptional $96,292 |
| Bulgarians | 99.9 /100 | #50 | Exceptional $96,290 |
| Estonians | 99.9 /100 | #51 | Exceptional $95,930 |
| Immigrants | South Africa | 99.9 /100 | #52 | Exceptional $95,800 |
| Paraguayans | 99.9 /100 | #53 | Exceptional $95,737 |
| Egyptians | 99.9 /100 | #54 | Exceptional $95,673 |
| Immigrants | Czechoslovakia | 99.9 /100 | #55 | Exceptional $95,319 |
| Immigrants | Austria | 99.9 /100 | #56 | Exceptional $95,277 |
| New Zealanders | 99.8 /100 | #57 | Exceptional $95,146 |
| Soviet Union | 99.8 /100 | #58 | Exceptional $95,098 |
| Immigrants | Europe | 99.8 /100 | #59 | Exceptional $95,032 |
| Koreans | 99.8 /100 | #60 | Exceptional $95,018 |
| Laotians | 99.8 /100 | #61 | Exceptional $94,990 |
| Immigrants | Norway | 99.8 /100 | #62 | Exceptional $94,846 |