Scandinavian vs Immigrants from Southern Europe Median Family Income
COMPARE
Scandinavian
Immigrants from Southern Europe
Median Family Income
Median Family Income Comparison
Scandinavians
Immigrants from Southern Europe
$104,410
MEDIAN FAMILY INCOME
70.8/ 100
METRIC RATING
158th/ 347
METRIC RANK
$110,614
MEDIAN FAMILY INCOME
98.3/ 100
METRIC RATING
91st/ 347
METRIC RANK
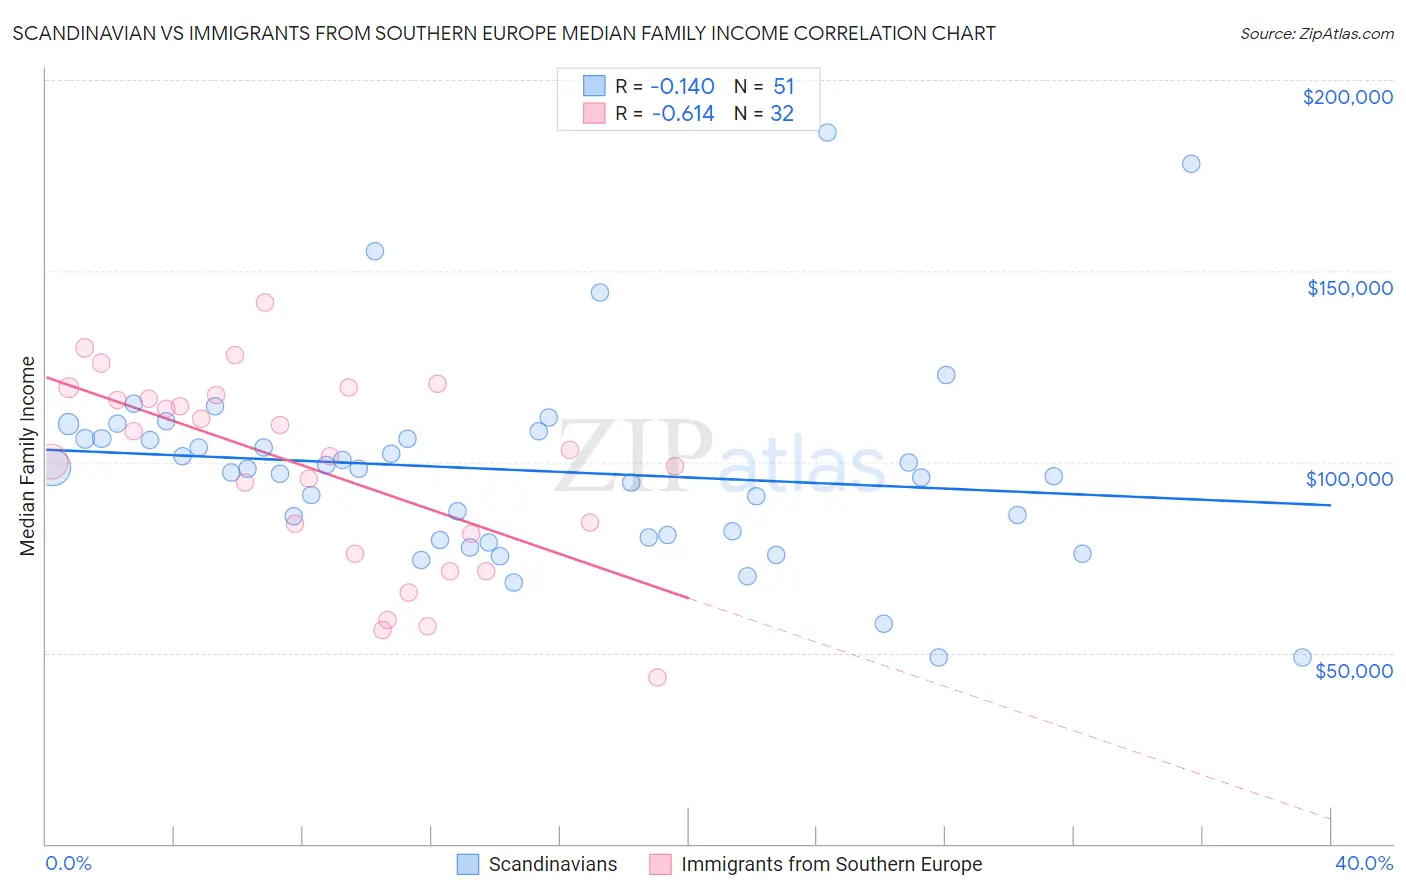
Scandinavian vs Immigrants from Southern Europe Median Family Income Correlation Chart
The statistical analysis conducted on geographies consisting of 472,034,552 people shows a poor negative correlation between the proportion of Scandinavians and median family income in the United States with a correlation coefficient (R) of -0.140 and weighted average of $104,410. Similarly, the statistical analysis conducted on geographies consisting of 402,509,296 people shows a significant negative correlation between the proportion of Immigrants from Southern Europe and median family income in the United States with a correlation coefficient (R) of -0.614 and weighted average of $110,614, a difference of 5.9%.
Median Family Income Correlation Summary
| Measurement | Scandinavian | Immigrants from Southern Europe |
| Minimum | $48,750 | $43,571 |
| Maximum | $186,250 | $141,836 |
| Range | $137,500 | $98,265 |
| Mean | $97,868 | $97,967 |
| Median | $98,046 | $102,217 |
| Interquartile 25% (IQ1) | $80,113 | $78,639 |
| Interquartile 75% (IQ3) | $106,098 | $117,023 |
| Interquartile Range (IQR) | $25,985 | $38,384 |
| Standard Deviation (Sample) | $26,299 | $25,189 |
| Standard Deviation (Population) | $26,040 | $24,793 |
Similar Demographics by Median Family Income
Demographics Similar to Scandinavians by Median Family Income
In terms of median family income, the demographic groups most similar to Scandinavians are Swiss ($104,396, a difference of 0.010%), Moroccan ($104,488, a difference of 0.080%), Scottish ($104,288, a difference of 0.12%), Icelander ($104,282, a difference of 0.12%), and Basque ($104,760, a difference of 0.34%).
| Demographics | Rating | Rank | Median Family Income |
| Peruvians | 80.4 /100 | #151 | Excellent $105,444 |
| Immigrants | Albania | 79.1 /100 | #152 | Good $105,285 |
| Slavs | 77.9 /100 | #153 | Good $105,144 |
| Immigrants | Nepal | 76.3 /100 | #154 | Good $104,966 |
| Native Hawaiians | 75.8 /100 | #155 | Good $104,910 |
| Basques | 74.4 /100 | #156 | Good $104,760 |
| Moroccans | 71.6 /100 | #157 | Good $104,488 |
| Scandinavians | 70.8 /100 | #158 | Good $104,410 |
| Swiss | 70.7 /100 | #159 | Good $104,396 |
| Scottish | 69.5 /100 | #160 | Good $104,288 |
| Icelanders | 69.4 /100 | #161 | Good $104,282 |
| Immigrants | Sierra Leone | 66.2 /100 | #162 | Good $103,990 |
| Costa Ricans | 66.2 /100 | #163 | Good $103,989 |
| Sierra Leoneans | 64.7 /100 | #164 | Good $103,859 |
| Slovaks | 63.1 /100 | #165 | Good $103,729 |
Demographics Similar to Immigrants from Southern Europe by Median Family Income
In terms of median family income, the demographic groups most similar to Immigrants from Southern Europe are Northern European ($110,635, a difference of 0.020%), Immigrants from Argentina ($110,873, a difference of 0.23%), Immigrants from Lebanon ($110,159, a difference of 0.41%), Immigrants from Kazakhstan ($110,137, a difference of 0.43%), and Korean ($110,103, a difference of 0.46%).
| Demographics | Rating | Rank | Median Family Income |
| Immigrants | Hungary | 98.8 /100 | #84 | Exceptional $111,378 |
| Croatians | 98.8 /100 | #85 | Exceptional $111,370 |
| Ukrainians | 98.8 /100 | #86 | Exceptional $111,368 |
| Austrians | 98.8 /100 | #87 | Exceptional $111,306 |
| Romanians | 98.8 /100 | #88 | Exceptional $111,243 |
| Immigrants | Argentina | 98.5 /100 | #89 | Exceptional $110,873 |
| Northern Europeans | 98.3 /100 | #90 | Exceptional $110,635 |
| Immigrants | Southern Europe | 98.3 /100 | #91 | Exceptional $110,614 |
| Immigrants | Lebanon | 97.9 /100 | #92 | Exceptional $110,159 |
| Immigrants | Kazakhstan | 97.8 /100 | #93 | Exceptional $110,137 |
| Koreans | 97.8 /100 | #94 | Exceptional $110,103 |
| Zimbabweans | 97.7 /100 | #95 | Exceptional $110,011 |
| Immigrants | Moldova | 97.7 /100 | #96 | Exceptional $109,975 |
| Jordanians | 97.5 /100 | #97 | Exceptional $109,865 |
| Immigrants | Kuwait | 97.4 /100 | #98 | Exceptional $109,731 |