Irish vs Immigrants from Southern Europe Median Family Income
COMPARE
Irish
Immigrants from Southern Europe
Median Family Income
Median Family Income Comparison
Irish
Immigrants from Southern Europe
$105,453
MEDIAN FAMILY INCOME
80.5/ 100
METRIC RATING
150th/ 347
METRIC RANK
$110,614
MEDIAN FAMILY INCOME
98.3/ 100
METRIC RATING
91st/ 347
METRIC RANK
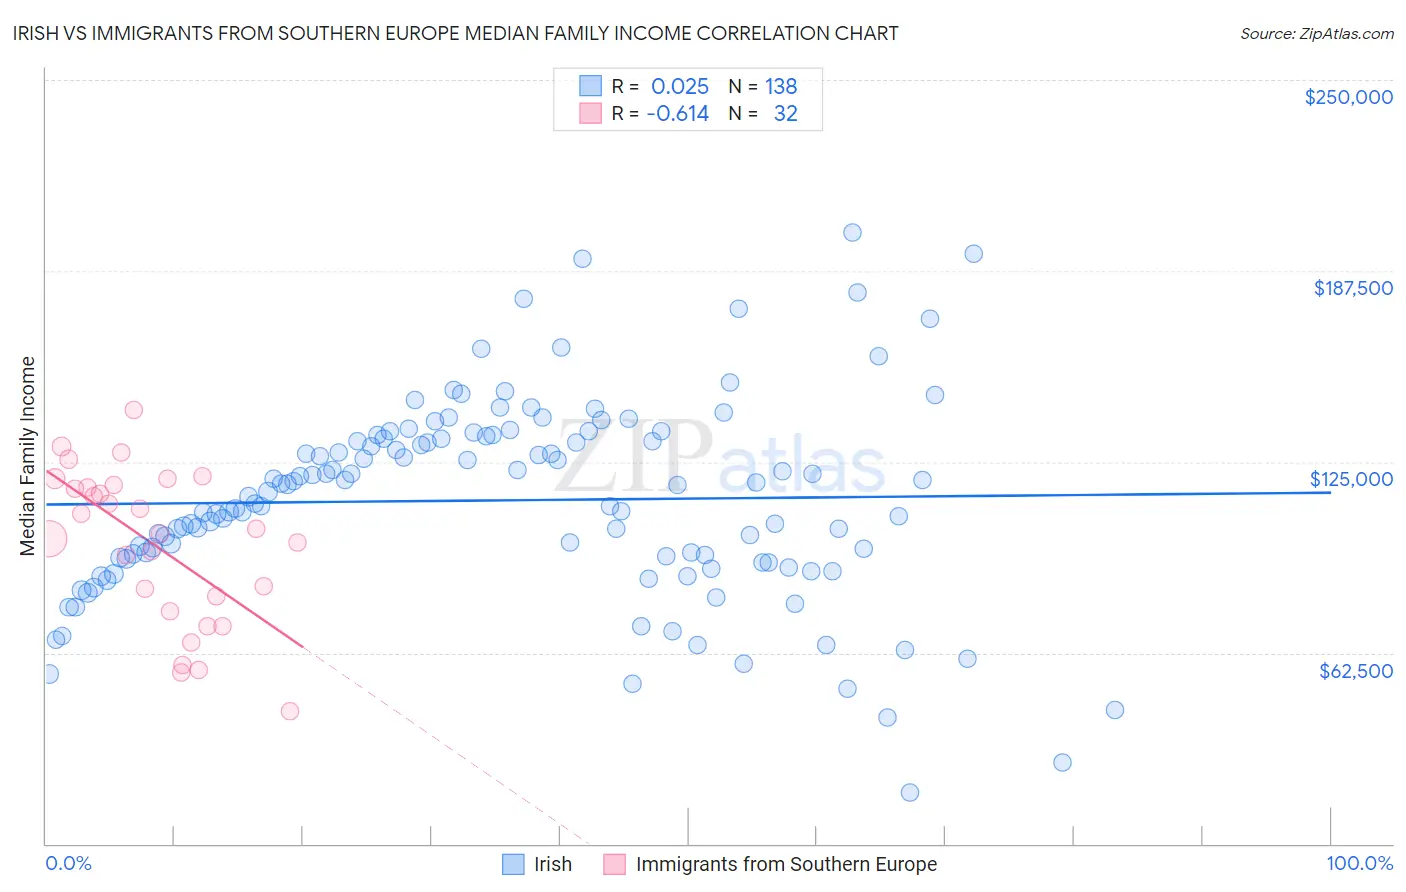
Irish vs Immigrants from Southern Europe Median Family Income Correlation Chart
The statistical analysis conducted on geographies consisting of 578,674,482 people shows no correlation between the proportion of Irish and median family income in the United States with a correlation coefficient (R) of 0.025 and weighted average of $105,453. Similarly, the statistical analysis conducted on geographies consisting of 402,509,296 people shows a significant negative correlation between the proportion of Immigrants from Southern Europe and median family income in the United States with a correlation coefficient (R) of -0.614 and weighted average of $110,614, a difference of 4.9%.
Median Family Income Correlation Summary
| Measurement | Irish | Immigrants from Southern Europe |
| Minimum | $16,721 | $43,571 |
| Maximum | $200,267 | $141,836 |
| Range | $183,546 | $98,265 |
| Mean | $112,390 | $97,967 |
| Median | $114,410 | $102,217 |
| Interquartile 25% (IQ1) | $93,102 | $78,639 |
| Interquartile 75% (IQ3) | $132,553 | $117,023 |
| Interquartile Range (IQR) | $39,451 | $38,384 |
| Standard Deviation (Sample) | $32,421 | $25,189 |
| Standard Deviation (Population) | $32,303 | $24,793 |
Similar Demographics by Median Family Income
Demographics Similar to Irish by Median Family Income
In terms of median family income, the demographic groups most similar to Irish are Peruvian ($105,444, a difference of 0.010%), Immigrants from Germany ($105,507, a difference of 0.050%), Hungarian ($105,609, a difference of 0.15%), Immigrants from Albania ($105,285, a difference of 0.16%), and Immigrants from Chile ($105,655, a difference of 0.19%).
| Demographics | Rating | Rank | Median Family Income |
| Tongans | 84.3 /100 | #143 | Excellent $105,967 |
| Immigrants | Morocco | 84.3 /100 | #144 | Excellent $105,964 |
| Danes | 83.8 /100 | #145 | Excellent $105,900 |
| Czechs | 83.4 /100 | #146 | Excellent $105,839 |
| Immigrants | Chile | 82.1 /100 | #147 | Excellent $105,655 |
| Hungarians | 81.7 /100 | #148 | Excellent $105,609 |
| Immigrants | Germany | 80.9 /100 | #149 | Excellent $105,507 |
| Irish | 80.5 /100 | #150 | Excellent $105,453 |
| Peruvians | 80.4 /100 | #151 | Excellent $105,444 |
| Immigrants | Albania | 79.1 /100 | #152 | Good $105,285 |
| Slavs | 77.9 /100 | #153 | Good $105,144 |
| Immigrants | Nepal | 76.3 /100 | #154 | Good $104,966 |
| Native Hawaiians | 75.8 /100 | #155 | Good $104,910 |
| Basques | 74.4 /100 | #156 | Good $104,760 |
| Moroccans | 71.6 /100 | #157 | Good $104,488 |
Demographics Similar to Immigrants from Southern Europe by Median Family Income
In terms of median family income, the demographic groups most similar to Immigrants from Southern Europe are Northern European ($110,635, a difference of 0.020%), Immigrants from Argentina ($110,873, a difference of 0.23%), Immigrants from Lebanon ($110,159, a difference of 0.41%), Immigrants from Kazakhstan ($110,137, a difference of 0.43%), and Korean ($110,103, a difference of 0.46%).
| Demographics | Rating | Rank | Median Family Income |
| Immigrants | Hungary | 98.8 /100 | #84 | Exceptional $111,378 |
| Croatians | 98.8 /100 | #85 | Exceptional $111,370 |
| Ukrainians | 98.8 /100 | #86 | Exceptional $111,368 |
| Austrians | 98.8 /100 | #87 | Exceptional $111,306 |
| Romanians | 98.8 /100 | #88 | Exceptional $111,243 |
| Immigrants | Argentina | 98.5 /100 | #89 | Exceptional $110,873 |
| Northern Europeans | 98.3 /100 | #90 | Exceptional $110,635 |
| Immigrants | Southern Europe | 98.3 /100 | #91 | Exceptional $110,614 |
| Immigrants | Lebanon | 97.9 /100 | #92 | Exceptional $110,159 |
| Immigrants | Kazakhstan | 97.8 /100 | #93 | Exceptional $110,137 |
| Koreans | 97.8 /100 | #94 | Exceptional $110,103 |
| Zimbabweans | 97.7 /100 | #95 | Exceptional $110,011 |
| Immigrants | Moldova | 97.7 /100 | #96 | Exceptional $109,975 |
| Jordanians | 97.5 /100 | #97 | Exceptional $109,865 |
| Immigrants | Kuwait | 97.4 /100 | #98 | Exceptional $109,731 |