Iraqi vs Immigrants from Southern Europe Family Poverty
COMPARE
Iraqi
Immigrants from Southern Europe
Family Poverty
Family Poverty Comparison
Iraqis
Immigrants from Southern Europe
9.3%
FAMILY POVERTY
24.2/ 100
METRIC RATING
198th/ 347
METRIC RANK
8.5%
FAMILY POVERTY
86.0/ 100
METRIC RATING
137th/ 347
METRIC RANK
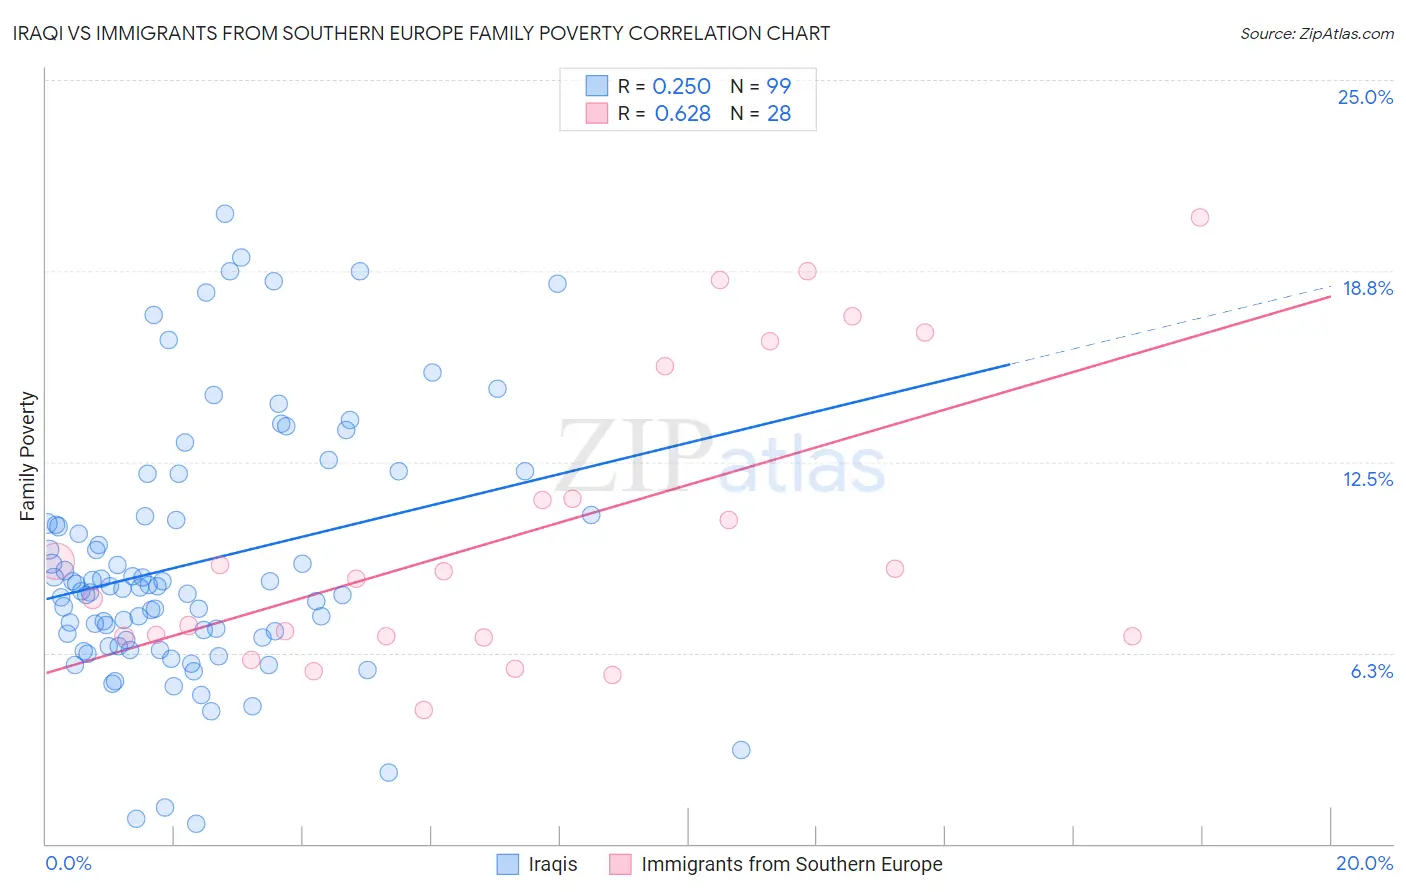
Iraqi vs Immigrants from Southern Europe Family Poverty Correlation Chart
The statistical analysis conducted on geographies consisting of 170,433,754 people shows a weak positive correlation between the proportion of Iraqis and poverty level among families in the United States with a correlation coefficient (R) of 0.250 and weighted average of 9.3%. Similarly, the statistical analysis conducted on geographies consisting of 401,468,990 people shows a significant positive correlation between the proportion of Immigrants from Southern Europe and poverty level among families in the United States with a correlation coefficient (R) of 0.628 and weighted average of 8.5%, a difference of 10.3%.
Family Poverty Correlation Summary
| Measurement | Iraqi | Immigrants from Southern Europe |
| Minimum | 0.67% | 4.4% |
| Maximum | 20.6% | 20.5% |
| Range | 19.9% | 16.1% |
| Mean | 9.2% | 10.2% |
| Median | 8.4% | 8.8% |
| Interquartile 25% (IQ1) | 6.7% | 6.8% |
| Interquartile 75% (IQ3) | 10.7% | 13.5% |
| Interquartile Range (IQR) | 4.1% | 6.7% |
| Standard Deviation (Sample) | 4.1% | 4.8% |
| Standard Deviation (Population) | 4.1% | 4.7% |
Similar Demographics by Family Poverty
Demographics Similar to Iraqis by Family Poverty
In terms of family poverty, the demographic groups most similar to Iraqis are Immigrants from Colombia (9.3%, a difference of 0.030%), Spaniard (9.4%, a difference of 0.25%), Immigrants from Venezuela (9.3%, a difference of 0.32%), Immigrants from Costa Rica (9.4%, a difference of 0.44%), and Venezuelan (9.3%, a difference of 0.53%).
| Demographics | Rating | Rank | Family Poverty |
| Ugandans | 28.7 /100 | #191 | Fair 9.3% |
| Spanish | 28.7 /100 | #192 | Fair 9.3% |
| Immigrants | Western Asia | 28.2 /100 | #193 | Fair 9.3% |
| South Americans | 28.1 /100 | #194 | Fair 9.3% |
| Venezuelans | 27.4 /100 | #195 | Fair 9.3% |
| Immigrants | Venezuela | 26.1 /100 | #196 | Fair 9.3% |
| Immigrants | Colombia | 24.4 /100 | #197 | Fair 9.3% |
| Iraqis | 24.2 /100 | #198 | Fair 9.3% |
| Spaniards | 22.8 /100 | #199 | Fair 9.4% |
| Immigrants | Costa Rica | 21.7 /100 | #200 | Fair 9.4% |
| Immigrants | Portugal | 20.5 /100 | #201 | Fair 9.4% |
| Immigrants | Sierra Leone | 19.6 /100 | #202 | Poor 9.4% |
| German Russians | 19.4 /100 | #203 | Poor 9.4% |
| Immigrants | Lebanon | 18.9 /100 | #204 | Poor 9.4% |
| Aleuts | 18.0 /100 | #205 | Poor 9.5% |
Demographics Similar to Immigrants from Southern Europe by Family Poverty
In terms of family poverty, the demographic groups most similar to Immigrants from Southern Europe are Immigrants from Brazil (8.5%, a difference of 0.080%), Immigrants from Malaysia (8.5%, a difference of 0.12%), Chilean (8.5%, a difference of 0.16%), Sri Lankan (8.5%, a difference of 0.17%), and Armenian (8.5%, a difference of 0.40%).
| Demographics | Rating | Rank | Family Poverty |
| Immigrants | Bosnia and Herzegovina | 88.6 /100 | #130 | Excellent 8.4% |
| Puget Sound Salish | 88.6 /100 | #131 | Excellent 8.4% |
| Immigrants | Argentina | 88.2 /100 | #132 | Excellent 8.4% |
| Sri Lankans | 86.6 /100 | #133 | Excellent 8.5% |
| Chileans | 86.6 /100 | #134 | Excellent 8.5% |
| Immigrants | Malaysia | 86.5 /100 | #135 | Excellent 8.5% |
| Immigrants | Brazil | 86.3 /100 | #136 | Excellent 8.5% |
| Immigrants | Southern Europe | 86.0 /100 | #137 | Excellent 8.5% |
| Armenians | 84.6 /100 | #138 | Excellent 8.5% |
| Immigrants | Nepal | 84.2 /100 | #139 | Excellent 8.5% |
| Immigrants | Kazakhstan | 84.1 /100 | #140 | Excellent 8.5% |
| Immigrants | Ukraine | 83.9 /100 | #141 | Excellent 8.5% |
| Yugoslavians | 83.5 /100 | #142 | Excellent 8.5% |
| Immigrants | Germany | 83.3 /100 | #143 | Excellent 8.5% |
| Albanians | 83.3 /100 | #144 | Excellent 8.5% |