Canadian vs Immigrants from Afghanistan Median Family Income
COMPARE
Canadian
Immigrants from Afghanistan
Median Family Income
Median Family Income Comparison
Canadians
Immigrants from Afghanistan
$106,597
MEDIAN FAMILY INCOME
88.1/ 100
METRIC RATING
131st/ 347
METRIC RANK
$108,709
MEDIAN FAMILY INCOME
95.6/ 100
METRIC RATING
109th/ 347
METRIC RANK
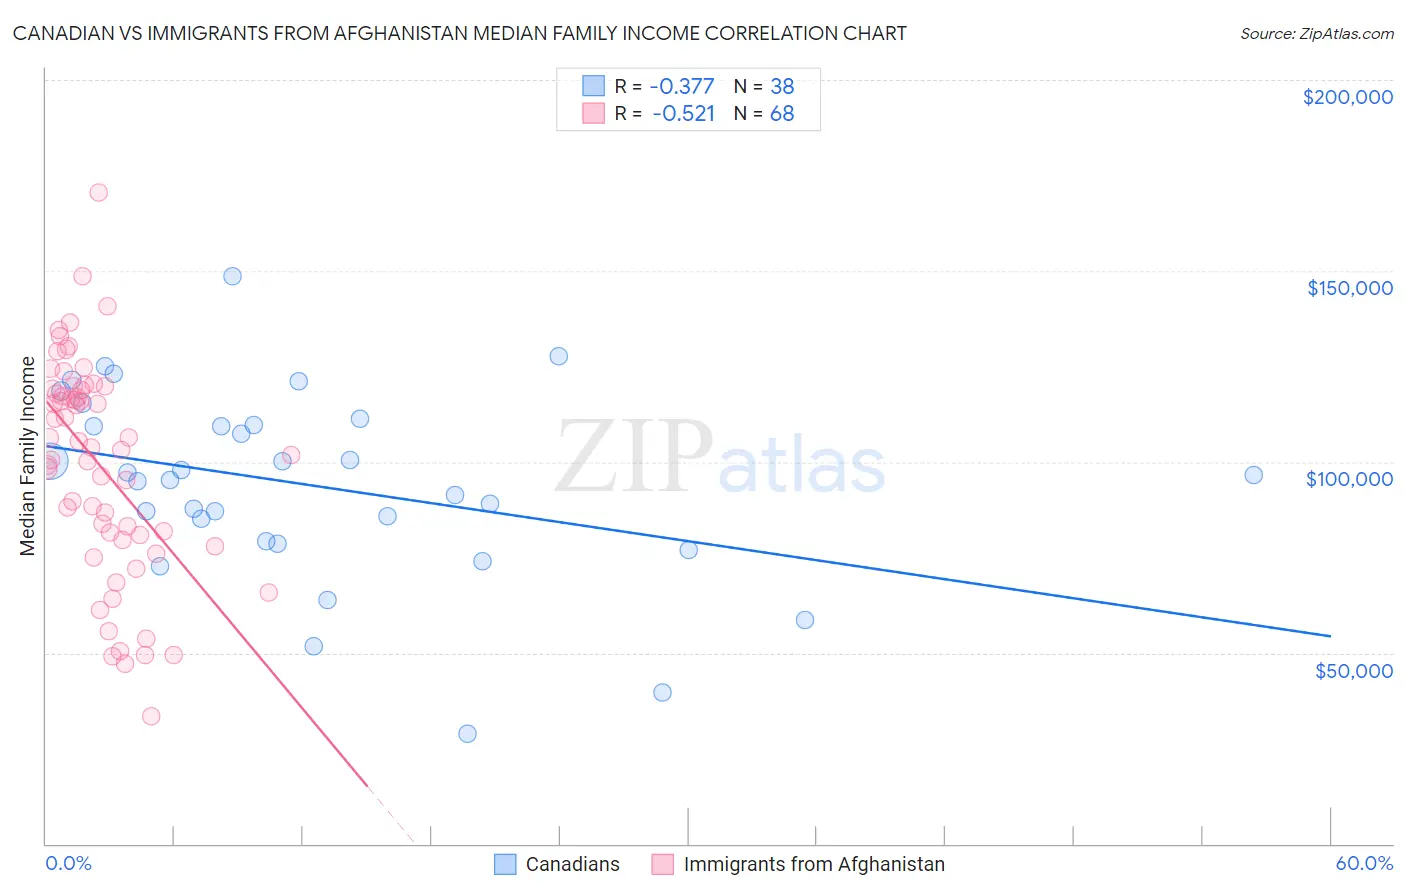
Canadian vs Immigrants from Afghanistan Median Family Income Correlation Chart
The statistical analysis conducted on geographies consisting of 437,117,064 people shows a mild negative correlation between the proportion of Canadians and median family income in the United States with a correlation coefficient (R) of -0.377 and weighted average of $106,597. Similarly, the statistical analysis conducted on geographies consisting of 147,629,265 people shows a substantial negative correlation between the proportion of Immigrants from Afghanistan and median family income in the United States with a correlation coefficient (R) of -0.521 and weighted average of $108,709, a difference of 2.0%.
Median Family Income Correlation Summary
| Measurement | Canadian | Immigrants from Afghanistan |
| Minimum | $28,715 | $33,250 |
| Maximum | $148,748 | $170,486 |
| Range | $120,033 | $137,236 |
| Mean | $93,902 | $99,044 |
| Median | $95,805 | $103,312 |
| Interquartile 25% (IQ1) | $79,333 | $80,208 |
| Interquartile 75% (IQ3) | $109,797 | $118,974 |
| Interquartile Range (IQR) | $30,464 | $38,766 |
| Standard Deviation (Sample) | $24,866 | $28,337 |
| Standard Deviation (Population) | $24,537 | $28,128 |
Similar Demographics by Median Family Income
Demographics Similar to Canadians by Median Family Income
In terms of median family income, the demographic groups most similar to Canadians are Immigrants from Fiji ($106,544, a difference of 0.050%), Ugandan ($106,541, a difference of 0.050%), Immigrants from Oceania ($106,453, a difference of 0.14%), Portuguese ($106,286, a difference of 0.29%), and Brazilian ($106,942, a difference of 0.32%).
| Demographics | Rating | Rank | Median Family Income |
| Pakistanis | 91.7 /100 | #124 | Exceptional $107,390 |
| Taiwanese | 91.4 /100 | #125 | Exceptional $107,295 |
| Serbians | 90.8 /100 | #126 | Exceptional $107,157 |
| Lebanese | 90.5 /100 | #127 | Exceptional $107,086 |
| Immigrants | Ethiopia | 90.0 /100 | #128 | Excellent $106,969 |
| Arabs | 89.9 /100 | #129 | Excellent $106,952 |
| Brazilians | 89.8 /100 | #130 | Excellent $106,942 |
| Canadians | 88.1 /100 | #131 | Excellent $106,597 |
| Immigrants | Fiji | 87.8 /100 | #132 | Excellent $106,544 |
| Ugandans | 87.8 /100 | #133 | Excellent $106,541 |
| Immigrants | Oceania | 87.3 /100 | #134 | Excellent $106,453 |
| Portuguese | 86.3 /100 | #135 | Excellent $106,286 |
| Immigrants | South Eastern Asia | 86.1 /100 | #136 | Excellent $106,252 |
| Immigrants | Uganda | 85.7 /100 | #137 | Excellent $106,188 |
| Immigrants | Vietnam | 85.7 /100 | #138 | Excellent $106,186 |
Demographics Similar to Immigrants from Afghanistan by Median Family Income
In terms of median family income, the demographic groups most similar to Immigrants from Afghanistan are British ($108,705, a difference of 0.0%), Immigrants from Western Asia ($108,691, a difference of 0.020%), Immigrants from Zimbabwe ($108,830, a difference of 0.11%), Immigrants from Poland ($108,570, a difference of 0.13%), and Immigrants from Saudi Arabia ($108,544, a difference of 0.15%).
| Demographics | Rating | Rank | Median Family Income |
| Assyrians/Chaldeans/Syriacs | 97.2 /100 | #102 | Exceptional $109,622 |
| Immigrants | Brazil | 96.9 /100 | #103 | Exceptional $109,418 |
| Palestinians | 96.9 /100 | #104 | Exceptional $109,413 |
| Syrians | 96.7 /100 | #105 | Exceptional $109,299 |
| Albanians | 96.4 /100 | #106 | Exceptional $109,136 |
| Immigrants | North Macedonia | 96.4 /100 | #107 | Exceptional $109,136 |
| Immigrants | Zimbabwe | 95.9 /100 | #108 | Exceptional $108,830 |
| Immigrants | Afghanistan | 95.6 /100 | #109 | Exceptional $108,709 |
| British | 95.6 /100 | #110 | Exceptional $108,705 |
| Immigrants | Western Asia | 95.6 /100 | #111 | Exceptional $108,691 |
| Immigrants | Poland | 95.3 /100 | #112 | Exceptional $108,570 |
| Immigrants | Saudi Arabia | 95.2 /100 | #113 | Exceptional $108,544 |
| Poles | 95.2 /100 | #114 | Exceptional $108,507 |
| Swedes | 95.1 /100 | #115 | Exceptional $108,499 |
| Chileans | 95.0 /100 | #116 | Exceptional $108,429 |