Thai vs Immigrants from Afghanistan Median Family Income
COMPARE
Thai
Immigrants from Afghanistan
Median Family Income
Median Family Income Comparison
Thais
Immigrants from Afghanistan
$131,281
MEDIAN FAMILY INCOME
100.0/ 100
METRIC RATING
6th/ 347
METRIC RANK
$108,709
MEDIAN FAMILY INCOME
95.6/ 100
METRIC RATING
109th/ 347
METRIC RANK
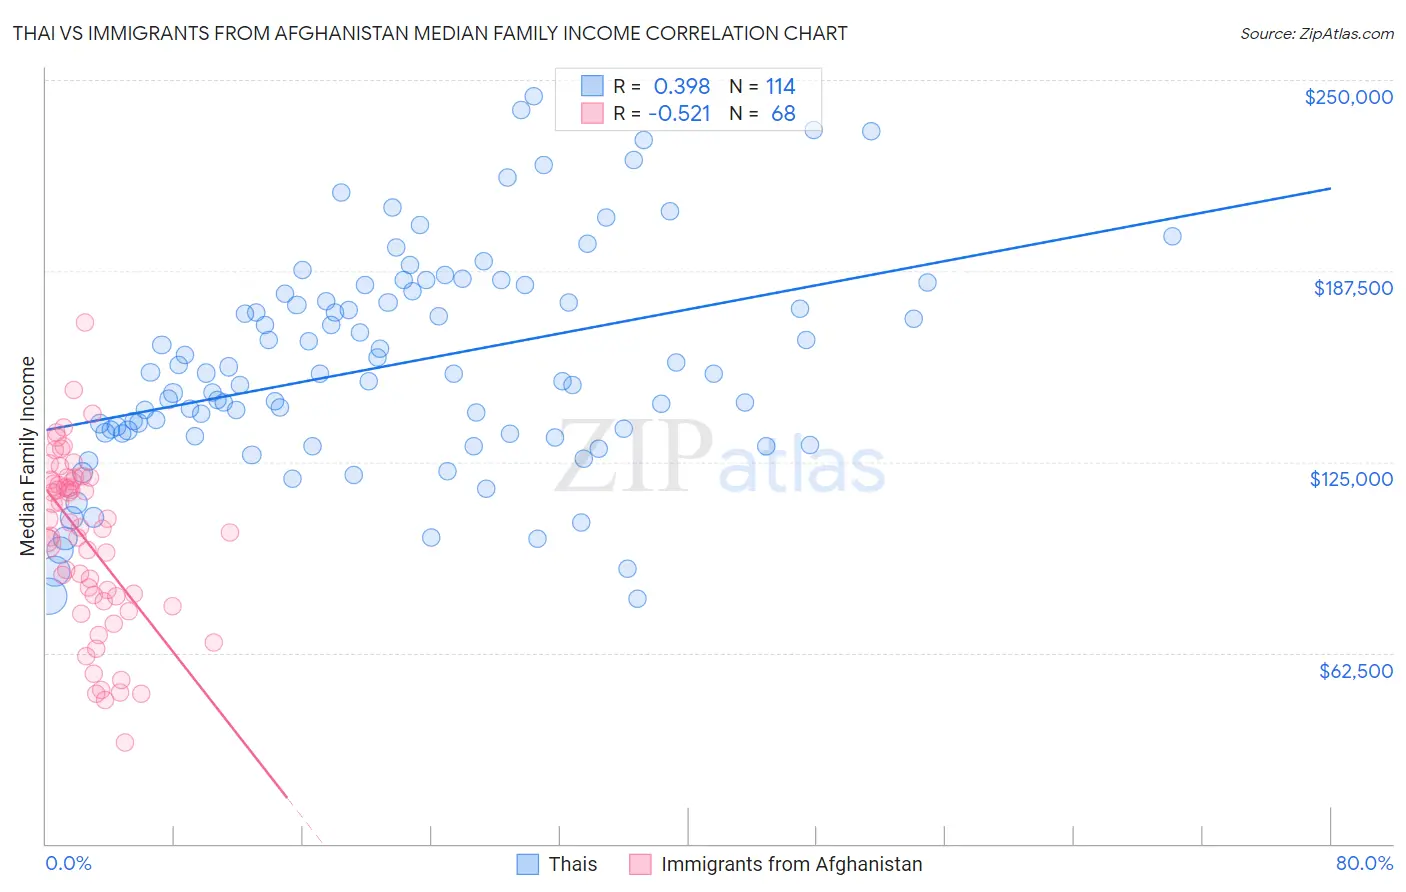
Thai vs Immigrants from Afghanistan Median Family Income Correlation Chart
The statistical analysis conducted on geographies consisting of 475,139,998 people shows a mild positive correlation between the proportion of Thais and median family income in the United States with a correlation coefficient (R) of 0.398 and weighted average of $131,281. Similarly, the statistical analysis conducted on geographies consisting of 147,629,265 people shows a substantial negative correlation between the proportion of Immigrants from Afghanistan and median family income in the United States with a correlation coefficient (R) of -0.521 and weighted average of $108,709, a difference of 20.8%.
Median Family Income Correlation Summary
| Measurement | Thai | Immigrants from Afghanistan |
| Minimum | $80,156 | $33,250 |
| Maximum | $244,604 | $170,486 |
| Range | $164,448 | $137,236 |
| Mean | $156,697 | $99,044 |
| Median | $153,787 | $103,312 |
| Interquartile 25% (IQ1) | $134,216 | $80,208 |
| Interquartile 75% (IQ3) | $179,995 | $118,974 |
| Interquartile Range (IQR) | $45,779 | $38,766 |
| Standard Deviation (Sample) | $35,454 | $28,337 |
| Standard Deviation (Population) | $35,298 | $28,128 |
Similar Demographics by Median Family Income
Demographics Similar to Thais by Median Family Income
In terms of median family income, the demographic groups most similar to Thais are Immigrants from Hong Kong ($131,067, a difference of 0.16%), Immigrants from Iran ($130,894, a difference of 0.30%), Okinawan ($129,979, a difference of 1.0%), Iranian ($133,839, a difference of 1.9%), and Immigrants from India ($134,028, a difference of 2.1%).
| Demographics | Rating | Rank | Median Family Income |
| Filipinos | 100.0 /100 | #1 | Exceptional $138,397 |
| Immigrants | Taiwan | 100.0 /100 | #2 | Exceptional $136,949 |
| Immigrants | Singapore | 100.0 /100 | #3 | Exceptional $134,818 |
| Immigrants | India | 100.0 /100 | #4 | Exceptional $134,028 |
| Iranians | 100.0 /100 | #5 | Exceptional $133,839 |
| Thais | 100.0 /100 | #6 | Exceptional $131,281 |
| Immigrants | Hong Kong | 100.0 /100 | #7 | Exceptional $131,067 |
| Immigrants | Iran | 100.0 /100 | #8 | Exceptional $130,894 |
| Okinawans | 100.0 /100 | #9 | Exceptional $129,979 |
| Immigrants | Ireland | 100.0 /100 | #10 | Exceptional $127,584 |
| Immigrants | Israel | 100.0 /100 | #11 | Exceptional $127,430 |
| Cypriots | 100.0 /100 | #12 | Exceptional $127,064 |
| Immigrants | Australia | 100.0 /100 | #13 | Exceptional $126,620 |
| Immigrants | South Central Asia | 100.0 /100 | #14 | Exceptional $125,956 |
| Eastern Europeans | 100.0 /100 | #15 | Exceptional $125,546 |
Demographics Similar to Immigrants from Afghanistan by Median Family Income
In terms of median family income, the demographic groups most similar to Immigrants from Afghanistan are British ($108,705, a difference of 0.0%), Immigrants from Western Asia ($108,691, a difference of 0.020%), Immigrants from Zimbabwe ($108,830, a difference of 0.11%), Immigrants from Poland ($108,570, a difference of 0.13%), and Immigrants from Saudi Arabia ($108,544, a difference of 0.15%).
| Demographics | Rating | Rank | Median Family Income |
| Assyrians/Chaldeans/Syriacs | 97.2 /100 | #102 | Exceptional $109,622 |
| Immigrants | Brazil | 96.9 /100 | #103 | Exceptional $109,418 |
| Palestinians | 96.9 /100 | #104 | Exceptional $109,413 |
| Syrians | 96.7 /100 | #105 | Exceptional $109,299 |
| Albanians | 96.4 /100 | #106 | Exceptional $109,136 |
| Immigrants | North Macedonia | 96.4 /100 | #107 | Exceptional $109,136 |
| Immigrants | Zimbabwe | 95.9 /100 | #108 | Exceptional $108,830 |
| Immigrants | Afghanistan | 95.6 /100 | #109 | Exceptional $108,709 |
| British | 95.6 /100 | #110 | Exceptional $108,705 |
| Immigrants | Western Asia | 95.6 /100 | #111 | Exceptional $108,691 |
| Immigrants | Poland | 95.3 /100 | #112 | Exceptional $108,570 |
| Immigrants | Saudi Arabia | 95.2 /100 | #113 | Exceptional $108,544 |
| Poles | 95.2 /100 | #114 | Exceptional $108,507 |
| Swedes | 95.1 /100 | #115 | Exceptional $108,499 |
| Chileans | 95.0 /100 | #116 | Exceptional $108,429 |